Crypto
Technical
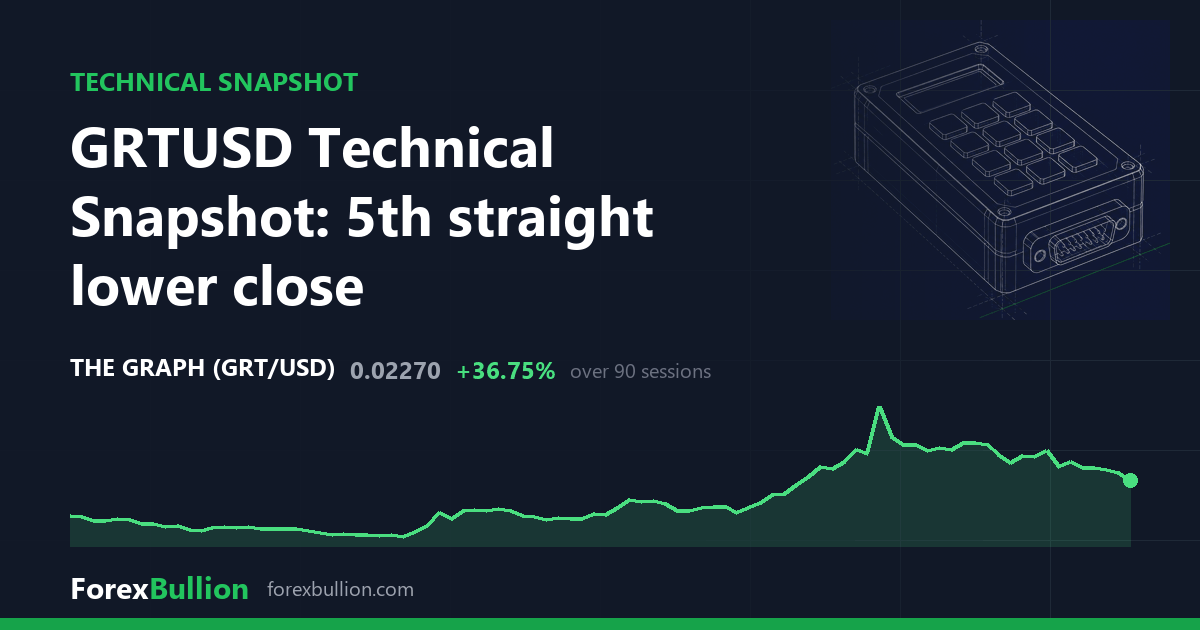
GRTUSD Technical Snapshot: 5th straight lower close
GRTUSD last traded at 0.0227, down 5.81% on the session and 70% below its 52-week high, with RSI at 40.6 and a fifth straight lower close.
GRTUSD last traded at 0.0227, down 5.81% on the session and 70% below its 52-week high, with RSI at 40.6 and a fifth straight lower close.
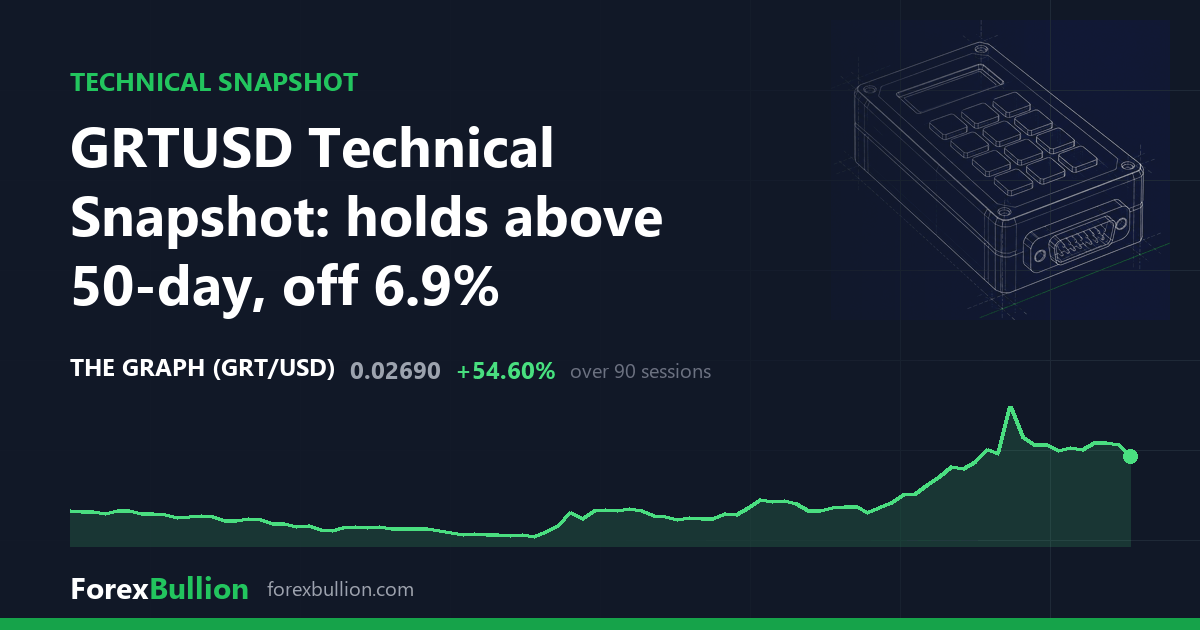
GRTUSD at 0.0269, down 6.92% on the session; RSI 54.5 and price 27% above its 50-day, while the weekly chart sits below its 50-week line.
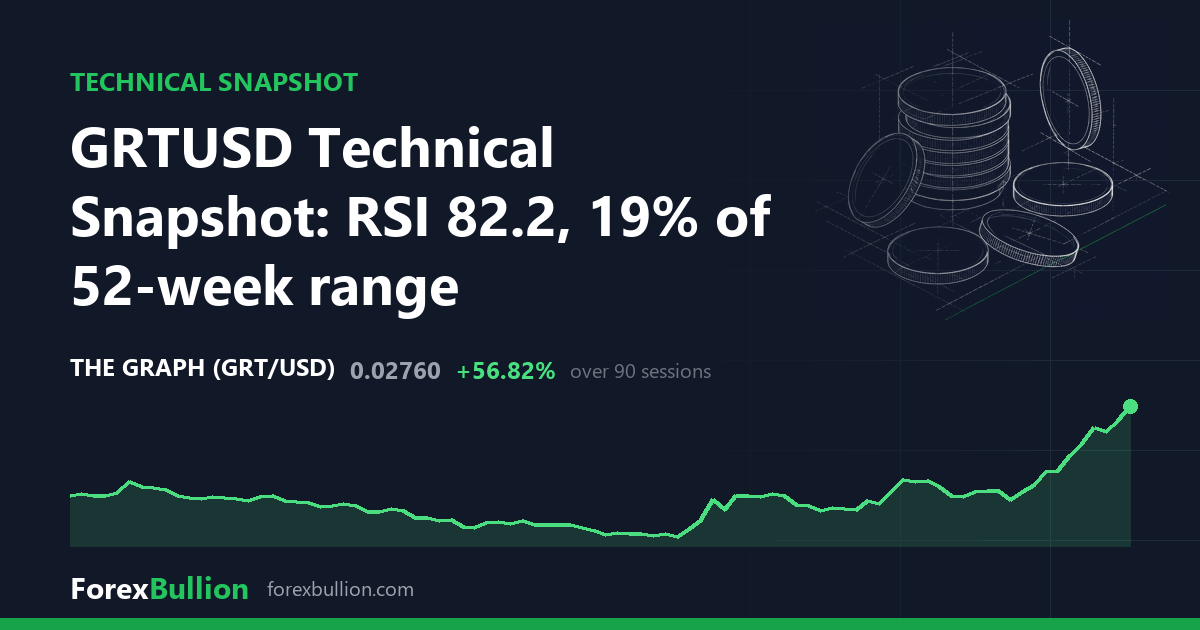
GRTUSD trades at 0.0276, up 6.15% with RSI at 82.2 and ATR near 6.16% of price, sitting in the lower fifth of its 52-week range. Descriptive read.
The Graph (GRT/USD) live price, chart, and analysis.
Markets showed a modest, mixed reaction after the FOMC Meeting Minutes landed at 18:00 UTC on 19 August 2026, with silver leading gains and The Graph slipping.
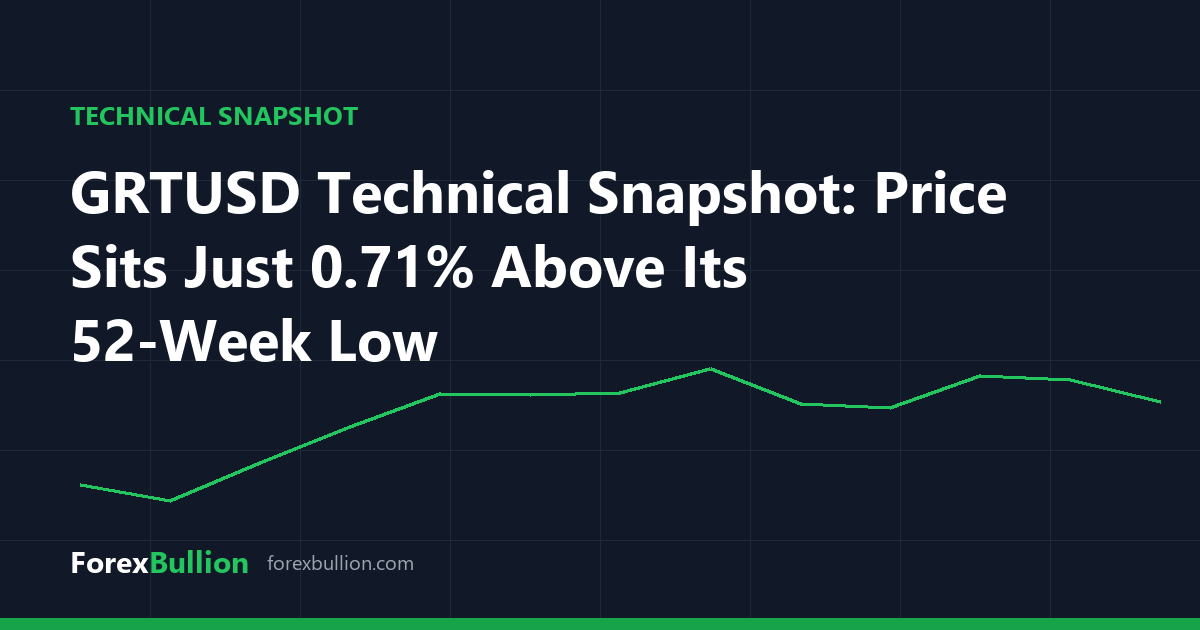
A descriptive technical read of GRTUSD at 0.0141, trading below all major moving averages with a depressed RSI of 22.4 and multi-timeframe declines.