Crypto
Technical
Solana Technical Snapshot: Above All Three Averages
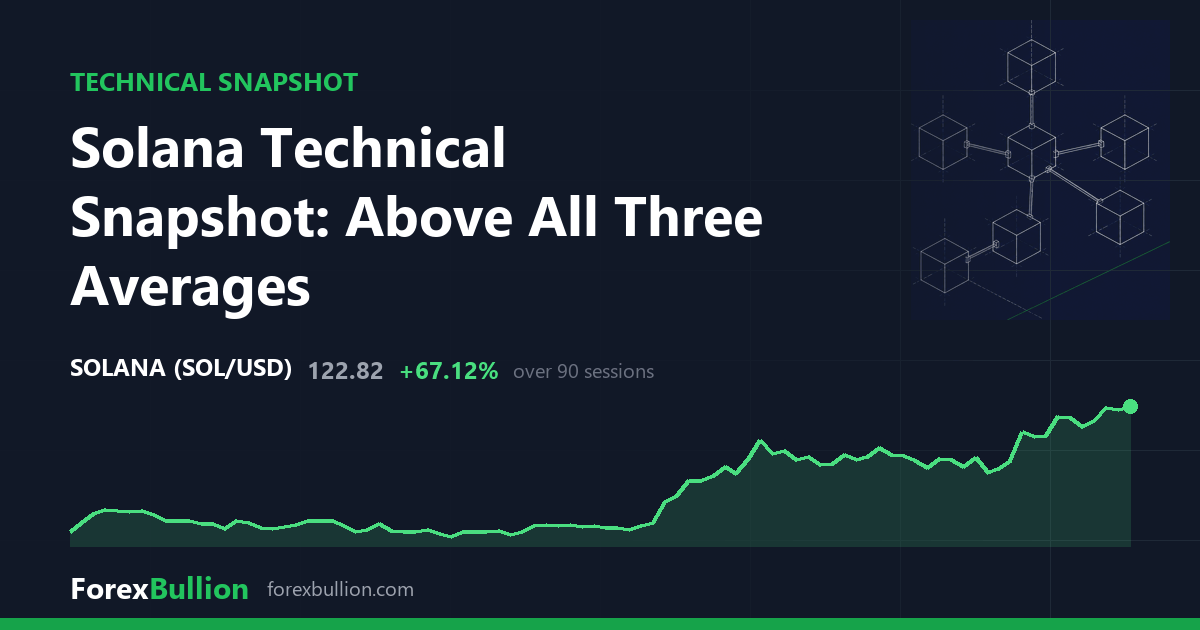
Solana (SOLUSD) trades at 122.82, up 1.24%, holding above its 20-, 50- and 200-day averages with RSI at 69.4 and ATR near its yearly midpoint.
Solana (SOLUSD) trades at 122.82, up 1.24%, holding above its 20-, 50- and 200-day averages with RSI at 69.4 and ATR near its yearly midpoint.
Altcoins topped the tape as GRT, Chainlink and Polkadot each ran 6-8%, while the Swedish krona firmed against the dollar. Oil held near 90.
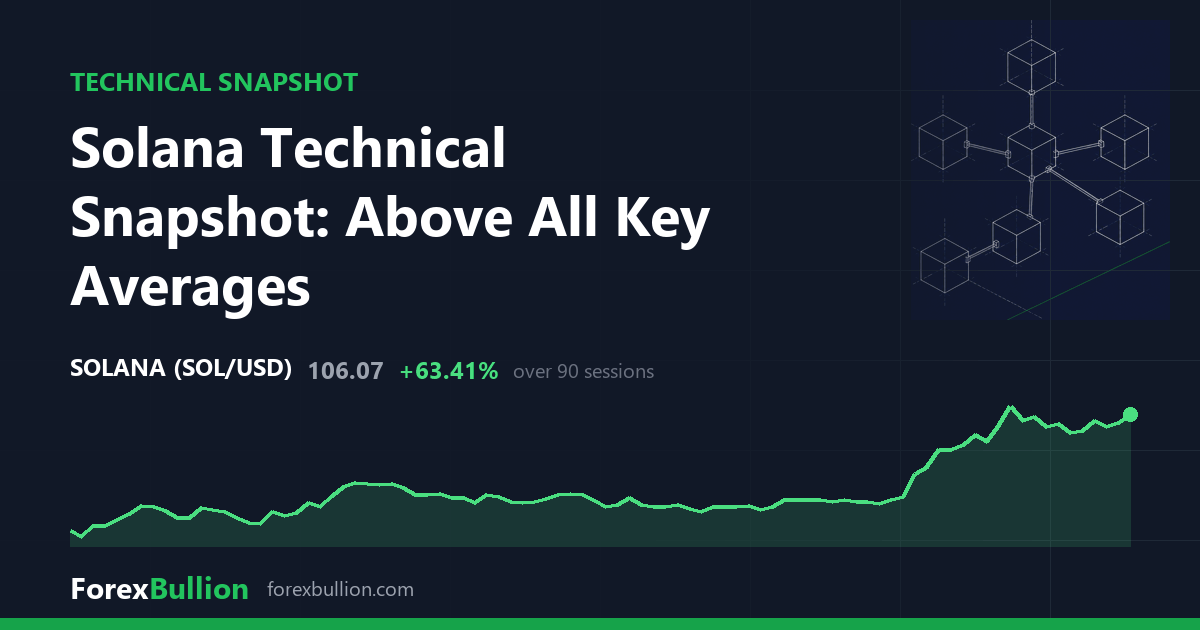
A descriptive technical read of Solana (SOLUSD) at 106.07, covering trend, RSI, ATR, its 52-week range and the weekly picture.
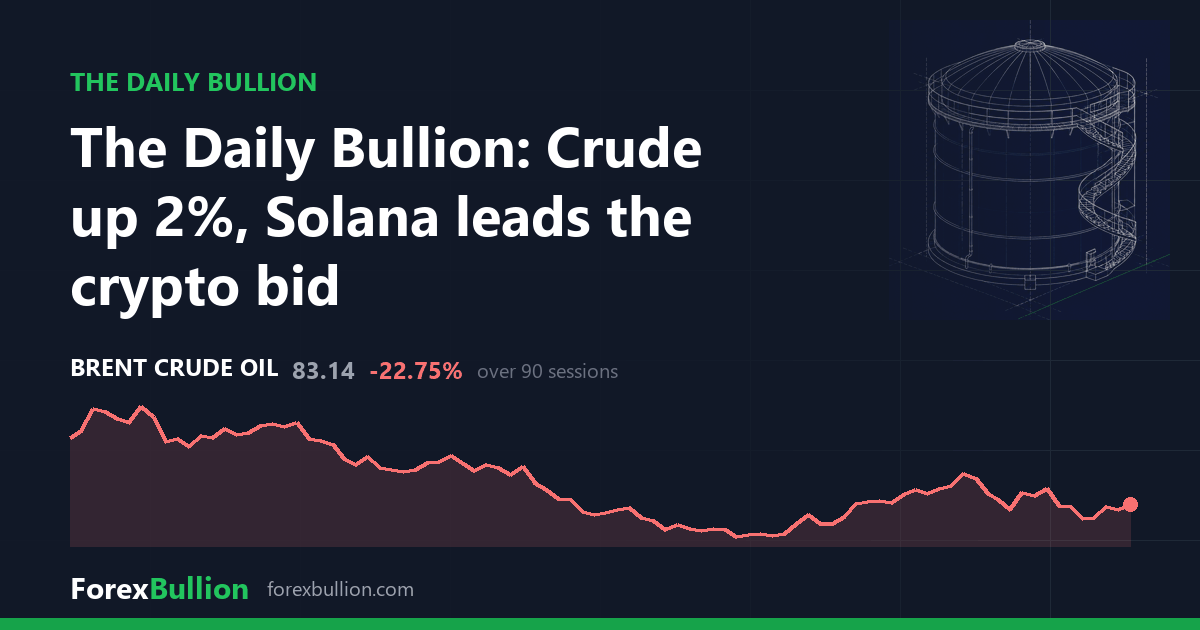
Solana led crypto with a 6.5% gain and Bitcoin cleared $80k, while crude rose over 2% and European stocks slipped into the US close.
Solana jumped 6.5% and crude climbed over 2% while Europe's bourses faded, with the CAC 40 down 1.4% into the London close.
Crypto majors ticked higher in the 30 minutes after the Fed's Warsh remarks and the US prelim benchmark payrolls revision on Aug 28, with SOL leading.
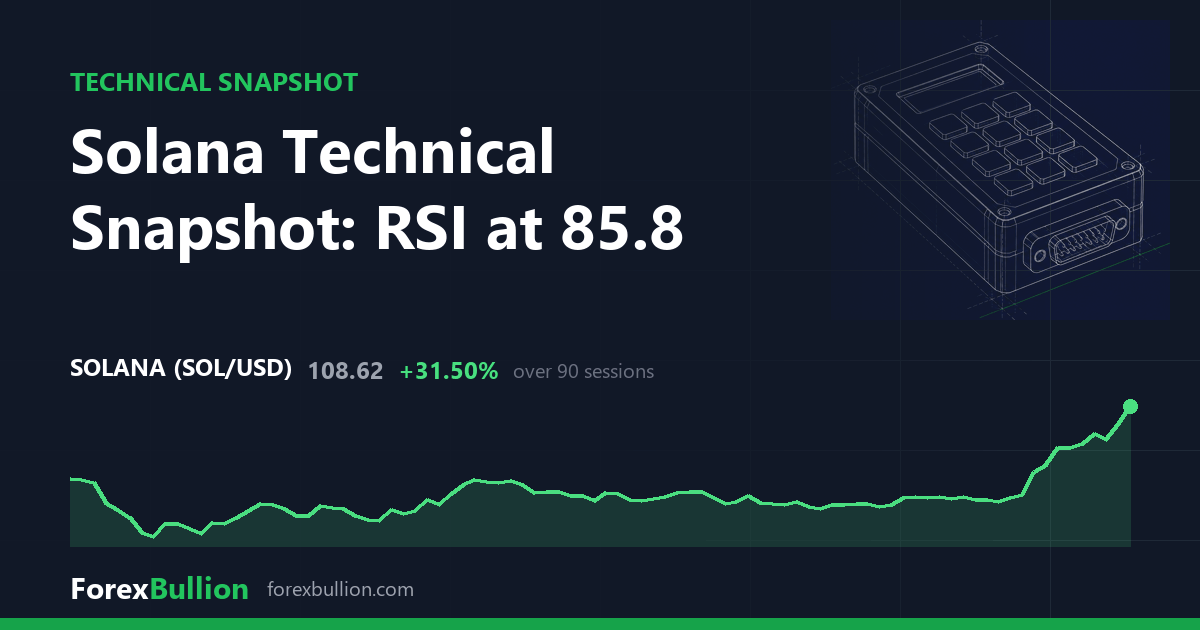
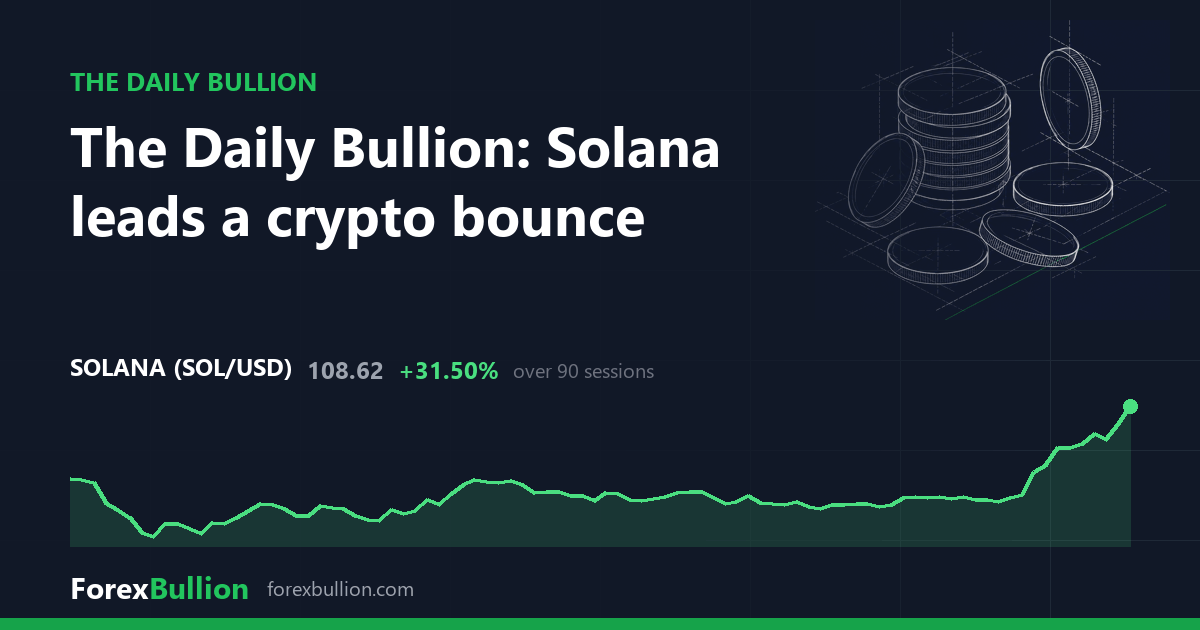
SOLUSD trades at 108.62, up 6.47% on the session, holding 33% above its 200-day average with an elevated RSI of 85.8. A descriptive technical read.
Solana jumps 6.47% and Bitcoin reclaims $80k as crypto leads the tape, while oil rebounds over 2% and European indices open on the back foot.
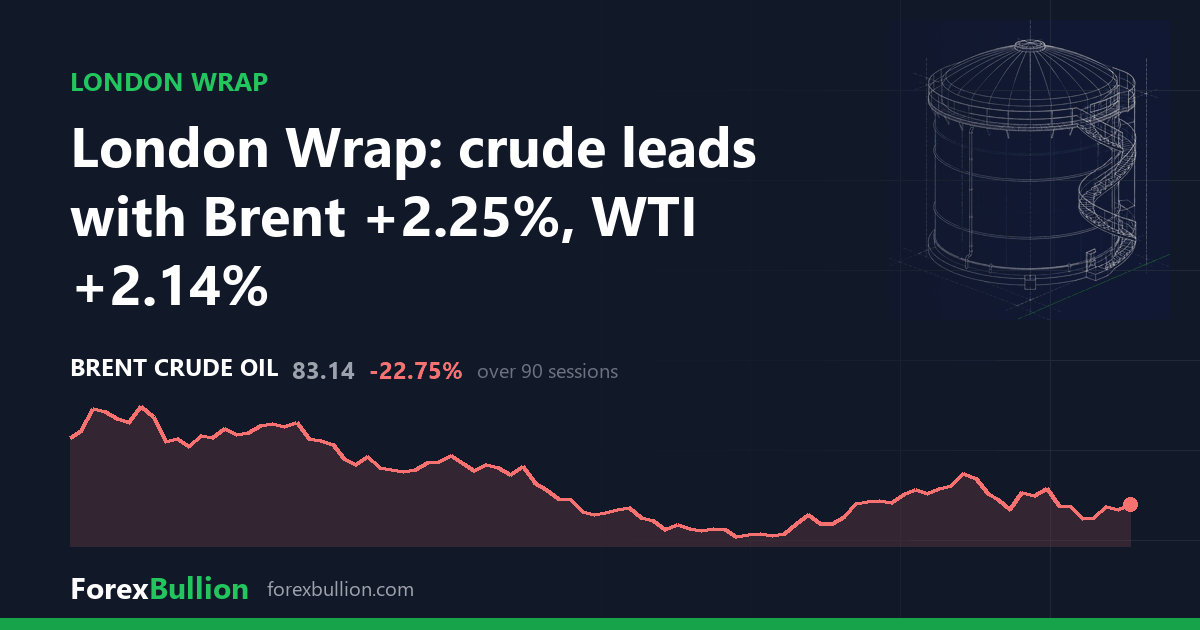
Brent hit $83.14 and WTI $78.02 as oil led the session, silver held a 9% weekly gain, and European indices closed mixed. The London wrap.
Brent and WTI both climb over 2% to start the session, Solana leads crypto, and silver holds a 9% weekly gain. Here's where the majors stand.
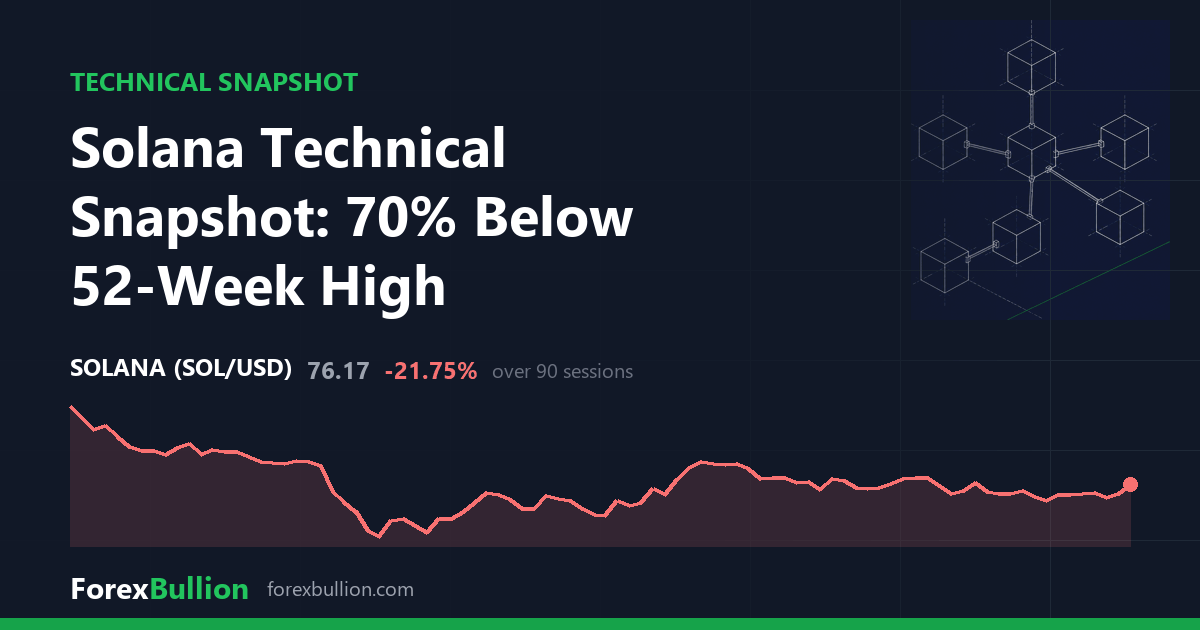
SOLUSD trades at 76.17, up 3.53% on the session, below its 200-day average with ATR at a one-year low and range position near the bottom.
Solana (SOL/USD) live price, chart, and analysis.