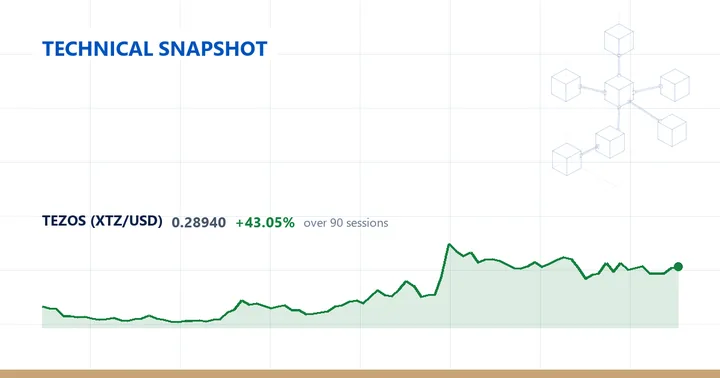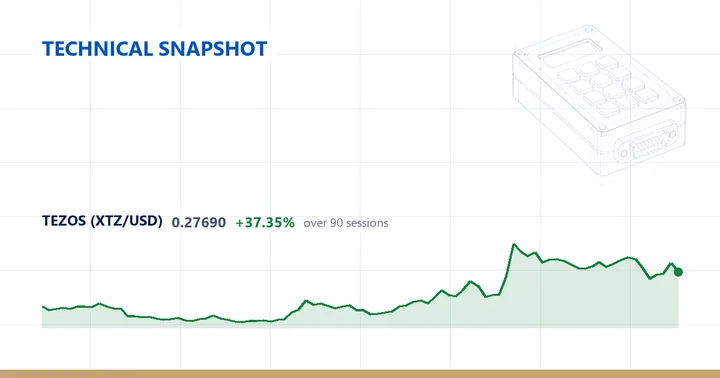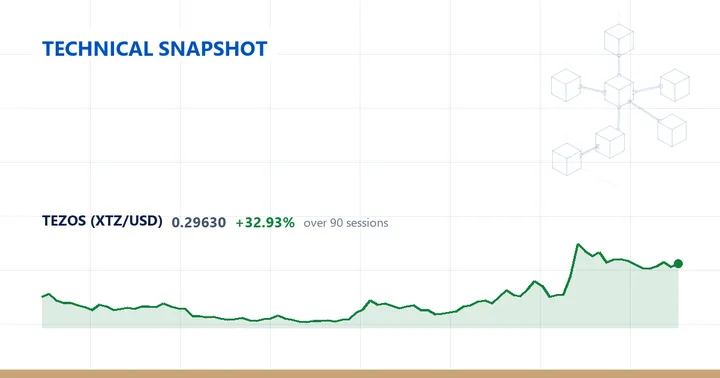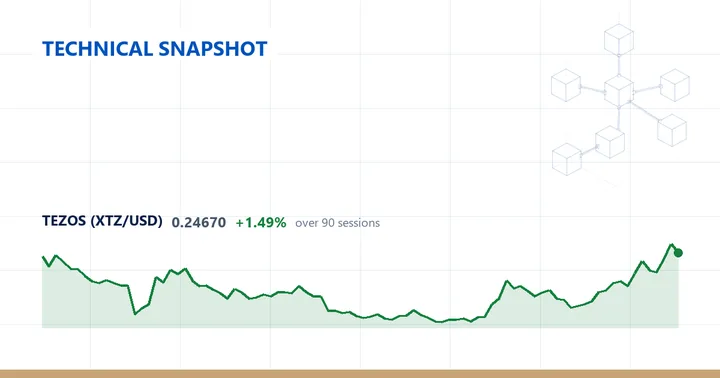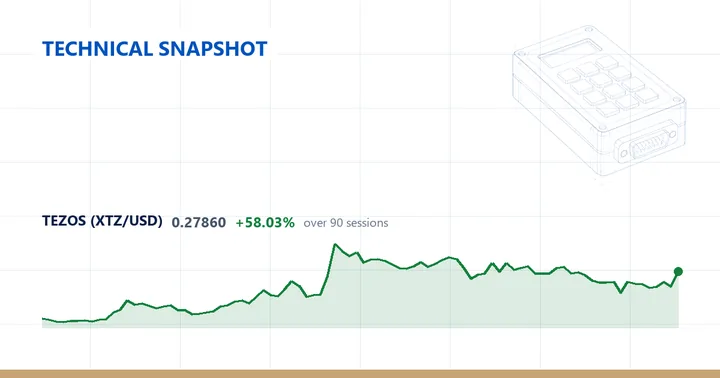
XTZUSD last traded at 0.2786, up 13.25% on the session.
Daily picture
The daily read is above the 200-day average but with a mixed short-term structure. Price sits 7.9% above the 200-day line (0.2582) and 6.38% above the 20-day (0.2619), yet 1.1% below the 50-day (0.2817). The 50-day is the highest of the three averages and sits just above the 0.2786 close, while the 20-day and 200-day both lie beneath it — so price sits between the 20-day below and the 50-day it has not reclaimed above. The +7.9% gap to the 200-day is the widest of the three readings and the −1.1% distance to the 50-day the narrowest.
RSI(14) reads 55.4, a neutral setting inside the 30-70 band and tilted modestly to the upper half. The 14-day ATR is 0.0233, equal to 8.36% of price. Measured against the instrument’s own past year, that volatility sits in the 62nd percentile — higher than roughly three fifths of daily readings over the last twelve months, so daily movement is wider than usual without being extreme.
Price is 62.65% below the 52-week high of 0.74586 and 68.54% above the 52-week low of 0.1653, which places it at the 20th percentile of its 52-week range — far nearer the 52-week low than its high. That high was set about 363 sessions ago, close to a year back, while the low is far more recent at 86 sessions ago. The past 20 sessions have spanned 0.2183 to 0.3097, and the 60-day range is wider, from 0.2064 to 0.3717, so the two-month high stands above the one-month high. The 0.2786 last price sits inside that 20-day band, below its 0.3097 high and above its 0.2183 low. Over the past week XTZUSD is up 10.21% and over the past month 5.93%.
Weekly picture
On the weekly bars the trend is below the 50-week average but with a mixed short-term structure. Price is 18.5% above the 20-week average (0.2351) but 16.61% below the 50-week average (0.3341), and the most recent weekly bar closed 10.73% higher. The weekly RSI(14) is 49.0, almost exactly mid-range and a touch softer than the daily 55.4. The two timeframes partly disagree: the daily chart holds price above its 200-day average, whereas the weekly chart keeps it below its 50-week average, even though both describe a mixed short-term structure and both place price above their shorter average.
Over the past year XTZUSD is down 59.88%, even after a 53.08% gain over the latest quarter.
Descriptive technical summary generated by the ForexBullion Research Team from our own price feed. Not investment advice.