

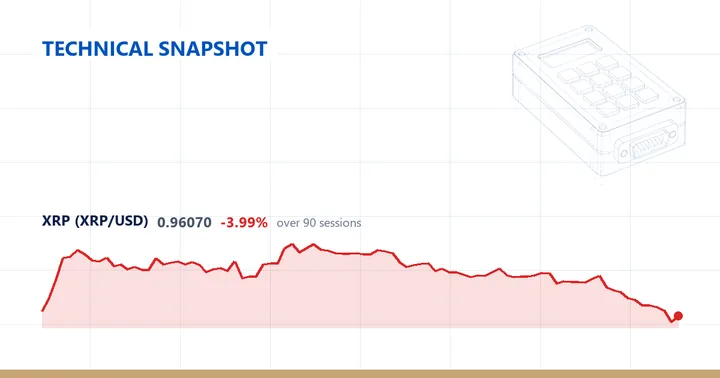
XRP (XRPUSD) last traded at 0.9607, up 5.21% on the session.
The chart sits below the 200-day average but with a mixed short-term structure. Price trades 17.32% under the 20-day average at 1.1619, 26.07% under the 50-day at 1.2994, and 23.38% under the 200-day at 1.2538 — below all three. The ordering of those averages captures the mix: the 50-day still holds above the 200-day, while the 20-day has rolled under both, leaving the shortest average the lowest of the three.
Momentum and volatility
Momentum reads depressed. The 14-day RSI is 25.2, inside the sub-30 zone often described as oversold. The 14-day ATR is 0.0622, equal to 6.47% of the 0.9607 price, and today’s 5.21% session gain falls within that average daily range. Measured against XRP’s own past year, the ATR sits at the 45th percentile — close to the middle of the daily swings the instrument has produced over twelve months, neither unusually quiet nor unusually volatile.
Price sits 60.24% below the 52-week high of 2.4164 and 7.75% above the 52-week low of 0.8916, placing it at the 5th percentile of its 52-week range, pinned near the floor of that band. The high was set 313 sessions ago, whereas the low was printed just one session ago, so the extreme in play is the recent one. In price terms the quote stands 0.0691 above that 0.8916 low, a little over one 14-day ATR of 0.0622. The 20-day and 60-day swing lows both rest on that same 0.8916 figure, while the 20-day swing high is 1.3422 and the wider 60-day swing high is 1.6571.
Weekly picture
The weekly frame confirms the daily one rather than contradicting it. It reads as a downtrend, with price below the 20-week average and the 20-week below the 50-week. Price is 23.03% under the 20-week average at 1.2481 and 31.78% under the 50-week at 1.4083 — wider gaps than any of the three daily averages show, the furthest being 26.07% below the 50-day. The last weekly bar closed down 13.54%, and the weekly 14-day RSI is 35.0, depressed but above the daily 25.2 and still clear of the sub-30 zone, so the slower timeframe reads less stretched than the daily even as both point the same way.
Over the past year XRP is down 56.58%, with the latest quarter off 4.09%, the month off 25.63%, and the trailing week off 12.41% — the quarter’s shallow slide against the far larger monthly fall places the heaviest losses in the most recent weeks.
Descriptive technical summary generated by the ForexBullion Research Team from our own price feed. Not investment advice.