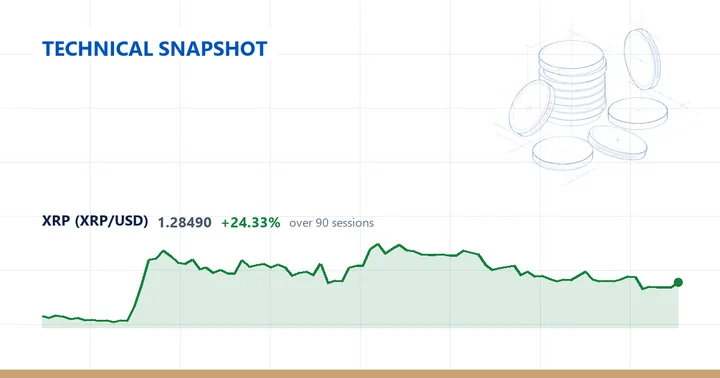
XRP (XRPUSD), a crypto CFD, last traded at $1.2849, up 3.03% on the session.
Trend, momentum and volatility
The daily structure is above the 200-day average but with a mixed short-term structure. At $1.2849 the price holds 0.9% above its 200-day average of 1.2734, yet trades 0.78% under the 20-day (1.295) and 7.19% below the 50-day (1.3844). The three averages are stacked with the 50-day on top, the 20-day beneath it and the 200-day lowest, so the longest-run average is the only one price currently sits above. The 7.19% gap under the 50-day is the widest of the three moving-average distances, marking the 50-day as the furthest overhead. The session’s 3.03% advance leaves price back within 0.78% of the 20-day average.
Momentum sits mid-range: the 14-day RSI reads 44.6, inside the neutral 30–70 band and below the 50 mark. The 14-day ATR is 0.0518, equal to 4.03% of price. Measured against its own past year that volatility is contained — the ATR sits at the 25th percentile of the last twelve months, in the lower quarter of its one-year range.
Range and timeframes
Price is 50.19% below the 52-week high of 2.5796 and 30.3% above the 52-week low of 0.9861, placing it at the 19th percentile of its 52-week range, toward the lower end. The two extremes sit at very different distances in time: the 52-week high was set 358 sessions ago, while the low is far more recent at 81 sessions back. Over the last 20 sessions price has ranged between a swing low of 1.1969 and a swing high of 1.3973, and the current 1.2849 sits inside that band. Across 60 sessions the swing high widens to 1.6571 while the low stays at 1.1969 — the same figure as the 20-day low, so the recent trough marks the lowest point in at least 60 sessions.
On the weekly chart the picture is below the 50-week average but with a mixed short-term structure. Price is 1.9% above the 20-week average (1.261) yet 10.5% below the 50-week (1.4356), and the weekly RSI reads 45.8, also neutral. The last completed week closed up 2.94%. The two timeframes part company on the long view: the daily chart has price 0.9% above its 200-day average of 1.2734, while the weekly keeps it 10.5% below a higher 50-week average of 1.4356.
Performance is split by horizon: XRP is up 21.15% over the quarter but down 14.7% over the past month and off 2.91% on the week. Over the past year it is down 41.72%.
Descriptive technical summary generated by the ForexBullion Research Team from our own price feed. Not investment advice.