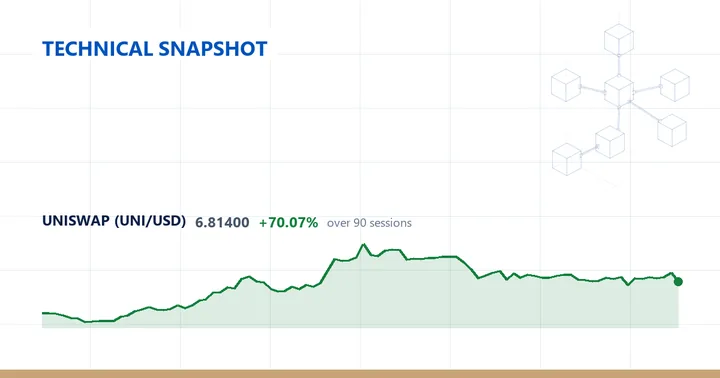
UNIUSD, a crypto CFD, last traded at 6.814, down 10.65% on the session.
Trend
The trend is flagged as insufficient history for a long-term trend read, and the computation rests on 109 daily bars. Against the shorter averages that are available, price sits below both. At 6.814 it is 4.32% under the 20-day simple moving average of 7.122 and 14.29% under the 50-day average of 7.9501. The two lines are themselves separated: the 50-day at 7.9501 stands 0.828 above the 20-day at 7.122, and price trades beneath each, so the near-term average sits under the medium-term one with the last price lower still.
Momentum, volatility and range
The 14-day RSI reads 44.0, which the data classes as neutral within the 30-70 band, set below the 50 midpoint but clear of the 30 oversold mark. Volatility stands out more than momentum: the 14-day ATR is 0.6362, equal to 9.34% of the 6.814 last price. An average true range near a tenth of price is the defining number here, marking UNIUSD as a wide daily mover in both absolute and percentage terms.
Price sits in the lower portion of its recent ranges. Over the past 20 sessions it has travelled between a swing low of 6.2515 and a swing high of 7.8215, a band 1.57 wide; the 6.814 last price is 0.5625 above that low and 1.0075 below that high, nearer the floor of the one-month range than its ceiling. The 20-day average of 7.122 falls inside that band, above the low and below the high, with the last price beneath it. The 60-session window is far wider: a swing high of 10.931 against a swing low of 5.808, a span of 5.123. The one-month high of 7.8215 sits 3.1095 below the three-month high of 10.931, and the one-month low of 6.2515 is 0.4435 above the three-month low of 5.808, so both the recent ceiling and the recent floor stand inside the wider range. Against the 60-day extremes, the current 6.814 is 1.006 above the low and 4.117 below the high.
Performance across the lookbacks diverges sharply. UNIUSD is down 4.62% over the past week and down 13.82% over the past month, while the quarter still shows a gain of 71.27%. The recent sessions, including today’s 10.65% drop, have pulled the one-week and one-month figures negative even as the three-month record stays well in positive territory. With the month at -13.82% and the quarter at +71.27%, the strength behind the quarterly figure sits earlier in the three-month window rather than in the last several weeks.
What the longer-term record shows is a quarter up 71.27% set against a month down 13.82%.
Descriptive technical summary generated by the ForexBullion Research Team from our own price feed. Not investment advice.