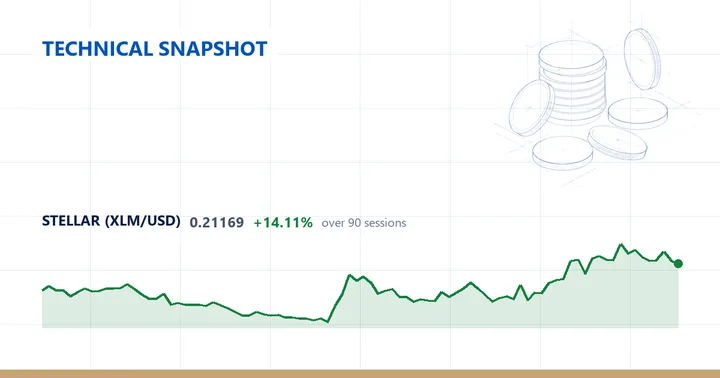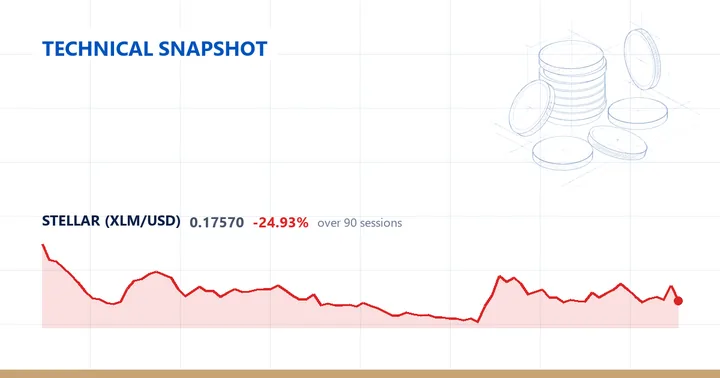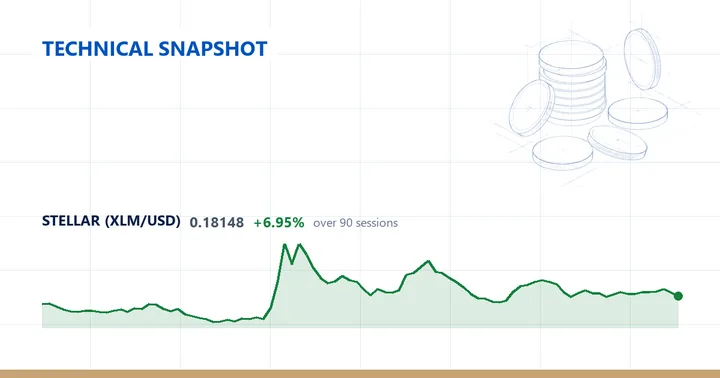

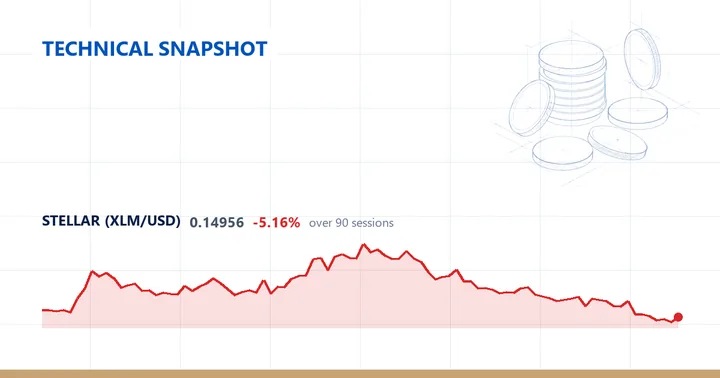
Stellar (XLMUSD) last traded at 0.14956, a gain of 3.65% on the session.
Daily structure
The daily trend reads as below the 200-day average but with a mixed short-term structure. Spot sits beneath all three major moving averages: 7.28% under the 20-day SMA at 0.1613, 19.2% under the 50-day at 0.1851, and 17.87% under the 200-day at 0.1821. The 20-day is the nearest of the three and itself sits below both longer averages, while the 50-day and 200-day are stacked within a cent of one another, the 50-day marginally the higher — the crossed-up arrangement behind the “mixed” label.
RSI(14) reads 35.6, a neutral value inside the 30-70 band but sitting toward its lower edge. The 14-day ATR is 0.0109, which is 7.29% of the 0.14956 price — a wide daily swing in percentage terms. Against Stellar’s own past year that absolute range lands at the 48th percentile, almost exactly mid-pack, so current volatility is neither stretched nor unusually compressed by the instrument’s recent standards.
On the range, price is 50.03% below the 52-week high of 0.29929 and 20.39% above the 52-week low of 0.12423, giving a range position of 14 on a 0-100 scale — the lower eighth of the yearly band. The high was set 363 sessions ago, close to a full year back, whereas the low was printed just 3 sessions ago, so today’s 3.65% advance follows close behind a fresh one-year trough. Both the 20-day and 60-day swing lows sit at that same 0.12423, confirming the recent low; above spot, the 20-day swing high stands at 0.17828 and the wider 60-day swing high at 0.23656. At 0.14956, price sits within that 20-day band of 0.12423 to 0.17828, nearer the floor than the top of the one-month range.
Weekly picture
The weekly timeframe reads as a downtrend, with price below the 20-week average and that 20-week below the 50-week. Spot is 17.69% under the 20-week SMA at 0.1817 and 18.54% under the 50-week at 0.1836, the two weekly averages themselves nearly level at roughly a tenth of a cent apart. Weekly RSI(14) is 41.5 — above the 35.6 daily reading but still beneath the 50 midpoint. The most recent weekly bar closed up 2.42%, even as the trailing seven-day performance shows -1.92%. The weekly downtrend agrees with the daily sub-200-day positioning: both timeframes lean the same direction.
Over the trailing year Stellar is down 46.07%, with the past month’s 21.23% fall outpacing the quarter’s 6.03% slide, leaving the year’s steepest losses concentrated in recent weeks.
Descriptive technical summary generated by the ForexBullion Research Team from our own price feed. Not investment advice.