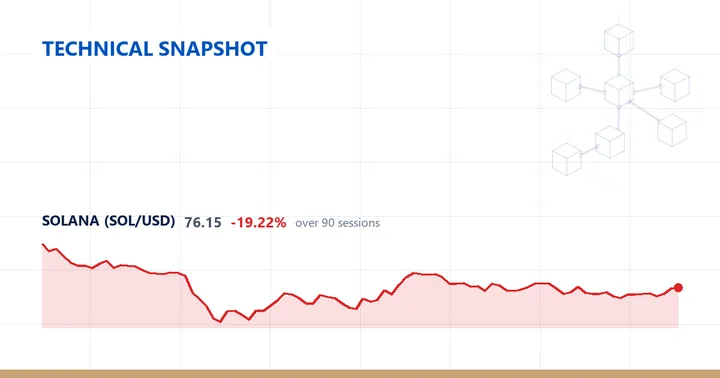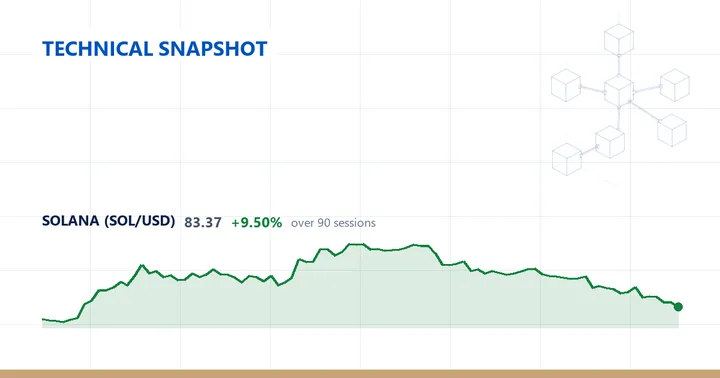
Solana (SOLUSD) last traded at 83.37, down 3.67% on the session.
The trend reads as below the 200-day average but with a mixed short-term structure, and the last price is beneath all three major averages. The 200-day at 88.9321 is the nearest overhead at 6.25% above price, the 20-day at 94.9755 is 12.22% away, and the 50-day at 105.932 is the furthest at 21.3%. Because the 200-day sits below both shorter averages, and the 20-day below the 50-day, the short-term picture is mixed rather than cleanly stacked.
Momentum is depressed: the 14-day RSI reads 24.3, at or below the 30 level often described as oversold. The 14-day ATR is 4.4733, equal to 5.37% of price, and the latest 3.67% session decline is contained within that one-ATR span. Measured against its own past year the ATR sits at the 41st percentile, a little below the middle of its twelve-month range, so recent daily swings are close to typical for this instrument rather than unusually wide.
At 83.37 price is 48.25% below the 52-week high of 161.09 and 38.76% above the 52-week low of 60.08, which puts it at the 23rd percentile of its 52-week range — the lower quarter of the yearly span, nearer the floor than the peak. That high was set 363 sessions ago — roughly a year back — and the low 157 sessions ago, so the peak is far behind while the trough is the more recent of the two extremes. The 20-day swing high is 107.34 and the 60-day swing high 124.85, recent peaks stepping lower, while the swing low reads 81.21 across both the 20- and 60-day windows — the nearest prior trough and just beneath the current price.
On the weekly timeframe the read is a downtrend, with price below the 20-week average and that 20-week average below the 50-week. Price sits 10.97% under the 20-week average at 93.6435 and 12.15% under the 50-week at 94.8952, and the most recent week closed down 3.48%. The weekly RSI14 is 41.2, above the daily reading and outside depressed territory. The two timeframes agree on direction, both holding price beneath their averages, though the weekly momentum gauge is less stretched than the daily one.
Over the past week Solana is down 12.66% and down 21.01% on the month, with the quarter the only positive window at 10.42%. Over the full year the market is down 46.06%, so the longer-term record remains a deep decline despite the three-month gain.
Descriptive technical summary generated by the ForexBullion Research Team from our own price feed. Not investment advice.