
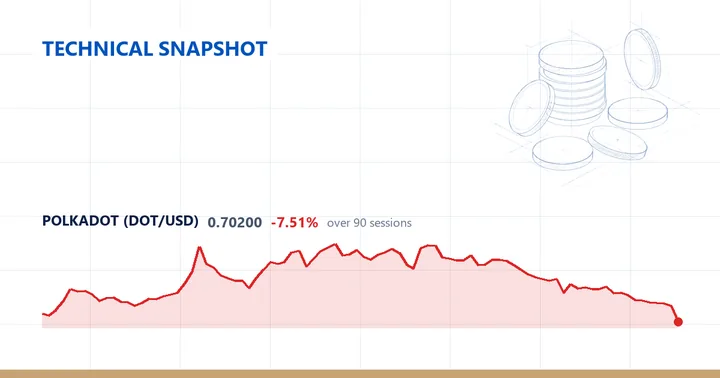
Polkadot (DOTUSD) last traded at $0.702, down 13.97% on the session after marking a fresh 52-week low of $0.686.
Trend and moving averages
The daily trend reads as below the 200-day average but with a mixed short-term structure, and price is beneath all three major averages. It sits 22.3% under the 20-day average at $0.9035, 33.71% under the 50-day at $1.059, and 30.04% under the 200-day at $1.0034. Those averages are not stacked in a single direction: the 20-day is the lowest of the three and the 50-day the highest, with the 200-day between them — the configuration the mixed-structure label points to.
The 14-day RSI reads 19.0, a depressed level in the zone often described as oversold. Volatility is comparatively muted against the instrument’s own history: the 14-day ATR is $0.0644, equal to 9.17% of price, and that ATR sits at the 29th percentile of the trailing twelve months — the lower third of the past year’s readings. So while the single-session fall of 13.97% is steep, the typical daily range behind it is below average for the year.
Range and weekly picture
Price is 75.75% below the 52-week high of $2.8948 and just 2.33% above the 52-week low of $0.686, which places it at the 1st percentile of its 52-week range — effectively at the floor. That low was set this very session, zero sessions ago, whereas the high dates back 363 sessions. The 20-day and 60-day swing lows both read $0.686, matching the annual low, while the 20-day swing high stands at $1.039 and the 60-day swing high at $1.303 overhead. The session also marks the 8th consecutive lower close.
On the weekly frame the picture agrees with the daily one. The weekly trend is a downtrend, with price below the 20-week average and the 20-week below the 50-week. Price runs 25.8% below the 20-week average at $0.9461 and 43.6% below the 50-week at $1.2447, and the most recent week closed down 18.37%. The weekly 14-day RSI is 33.8 — above the daily RSI of 19.0 but still toward the lower end of its range — so both timeframes lean the same direction, with the weekly reading the less stretched of the two.
Over the past year DOTUSD is down 75.19%, with declines of 7.14% over the quarter, 40.56% over the month, and 18.37% over the week.
Descriptive technical summary generated by the ForexBullion Research Team from our own price feed. Not investment advice.