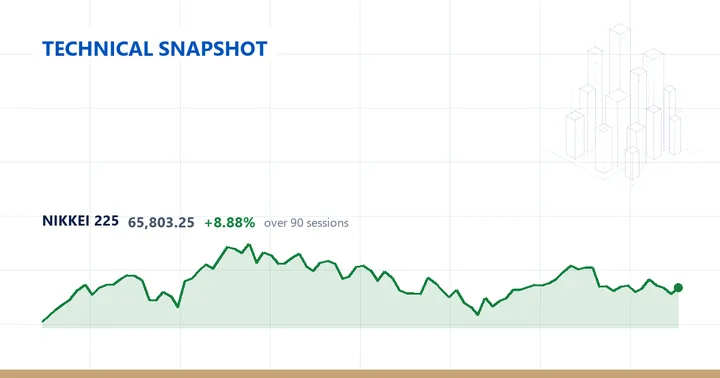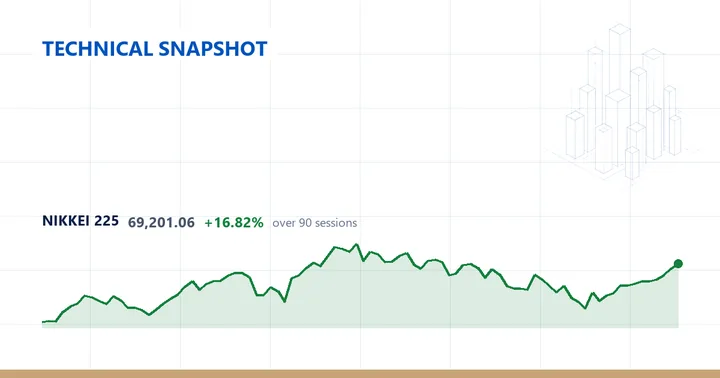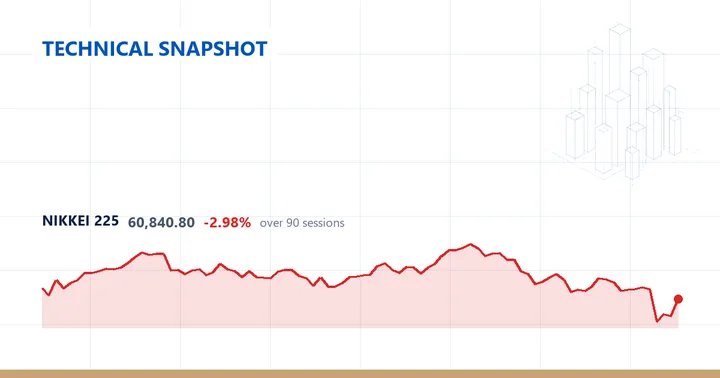
The Nikkei 225 (JP225) index CFD last traded at 60,840.8, up 5.09% on the session.
Trend and structure
The daily read is below the 200-day average but with a mixed short-term structure. Price sits 4.94% under its 200-day SMA (64,005.01), 6.41% under the 50-day (65,005.03), and 2.50% under the 20-day (62,402.44), leaving it beneath all three. Within that stack the 20-day is the lowest line, the 200-day sits in the middle, and the 50-day is the highest, so the shorter average has crossed below the longer two. The 5.09% advance is a large single-session move, but it runs against a softer recent record: the index is down 3.31% over the past week, 11.84% over the month, and 9.49% over the quarter.
Momentum, range and weekly context
Momentum is mid-band: the 14-day RSI reads 43.2, inside the neutral 30–70 band and nearer its lower edge than its upper. The 14-day ATR is 1,955.64, or 3.21% of price, and at the 88th percentile of its own past year that daily range sits among the widest in twelve months — a neutral oscillator paired with volatility near the top of its yearly band.
Within its longer range the index sits at the midpoint, a range position of 50 out of 100. It stands 17.36% below the 52-week high of 73,620.5, last touched 120 sessions ago, and 26.77% above the 52-week low of 47,994.0, set 302 sessions ago — the peak is far more recent than the trough. The nearer structure is tighter: the 20-day swing runs from 65,396.61 — a level sitting just above the 50-day average — down to 56,395.35, and the 60-day band reaches up to 71,327.54 while resting on that same 56,395.35 low, so the one-month floor doubles as the two-month floor. At 60,840.8 the index trades within that 20-day span, and because the yearly high predates the 60-day lookback, the 60-day peak is the nearer high overhead.
On the weekly timeframe, built from 59 bars, the trend is above the 50-week average but with a mixed short-term structure. Price is 0.54% above the 50-week SMA (60,513.64) yet 6.8% below the 20-week SMA (65,279.03), so it sits between its two weekly averages rather than beneath both as on the daily chart. The weekly RSI is 45.8, mid-band and close to the daily 43.2, on a weekly gain of 5.09%. The two timeframes disagree: the daily chart holds below its 200-day line while the weekly holds above its 50-week line.
Across the past year, measured over 344 daily bars, JP225 shows a gain of 18.38% — the one positive reading among the week, month, quarter and year windows.
Descriptive technical summary generated by the ForexBullion Research Team from our own price feed. Not investment advice.