

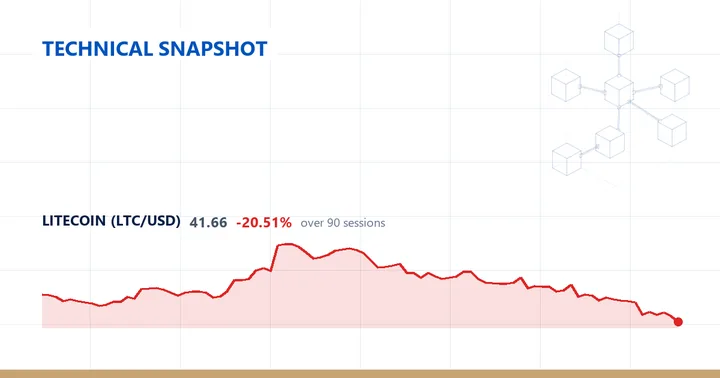
Litecoin (LTCUSD) last traded at $41.66, down 5.19% on the session.
Trend and momentum
Computed across 401 daily bars, the trend is characterised as below the 200-day average but with a mixed short-term structure. At 41.66 the price trades 19.19% under the 200-day line (51.55), 16.48% under the 20-day (49.88) and 26.95% under the 50-day (57.03) — the 50-day the widest gap and the 20-day the narrowest. The 20-day and 200-day lines sit close together while the 50-day stands notably higher above them. The averages are not cleanly stacked: the 20-day sits below the 50-day, yet the 50-day holds above the 200-day, so the longest line has not fully rolled over even with price beneath all three. The reading follows 2 consecutive lower closes.
RSI(14) reads 25.5, a depressed value at or below 30 that is often described as oversold. The 14-day ATR is 2.77, equal to 6.65% of price, which keeps the session’s 5.19% decline inside a single average day’s range. Measured against Litecoin’s own history that ATR sits at the 57th percentile of the past year — a little above the twelve-month median rather than an extreme, a weak momentum reading paired with mid-range volatility.
Range and timeframes
Within its annual range the price sits near the floor. It is 52.94% below the 52-week high of 88.53 and only 6.28% above the 52-week low of 39.20, so the floor is close while the ceiling is distant; that is the 5th percentile of the 52-week band. The 20-day swing spans 41.64 to 56.93, and the 41.64 low is also the 60-day swing low, so the one-month and two-month bases coincide, with 41.66 holding fractionally above them; the 60-day swing high is 75.01. Timing separates the extremes: the 52-week high was set 363 sessions ago, while the 52-week low is far more recent at 147 sessions back, so the yearly peak predates the current decline while the trough falls within it.
Drawn from 58 weekly bars, the weekly picture is an outright downtrend: price trades 21.01% below the 20-week average (52.74), and the 20-week itself sits below the 50-week (55.86), which price is 25.42% under. Last week closed down 8.42%, a weekly bar larger than the latest daily session’s 5.19% move. The weekly RSI(14) is 37.4, softer than the daily 25.5 and not yet at a depressed level. The two timeframes agree on direction, with price beneath every daily and weekly average cited here.
Over the trailing year LTCUSD is down 52.18%, and the decline is weighted toward recent weeks: the past month’s 32.25% fall exceeds the full quarter’s 21.60%, while the past week accounts for 15.43%.
Descriptive technical summary generated by the ForexBullion Research Team from our own price feed. Not investment advice.