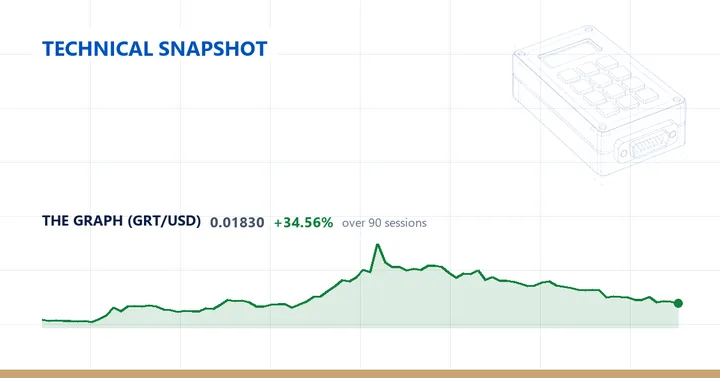
GRTUSD last changed hands at 0.0183, down 2.66% on the session and extending to two consecutive lower closes.
Trend and momentum
The daily read is below the 200-day average but with a mixed short-term structure. The last price sits under all three major averages — 12.02% below the 200-day SMA at 0.0208, 13.27% below the 20-day at 0.0211 and 25.31% below the 50-day at 0.0245. The 200-day actually sits just beneath the 20-day while the 50-day is the highest of the three, so the moving-average stack is compressed rather than cleanly ordered.
RSI(14) reads 31.7, which the data classes as neutral within the 30–70 band. At 31.7 it sits closer to the oversold 30 line than to the overbought 70 line while remaining inside that neutral zone. The 14-day ATR is 0.0015, equal to 8.2% of price; at the 41st percentile of the past year, that daily range sits just below the midpoint of the readings recorded over the last twelve months. The session’s 2.66% pullback is well within that average daily range.
Range and weekly picture
Price is 74.04% below the 52-week high of 0.0705 and 42.97% above the 52-week low of 0.0128, placing it at the 10th percentile of its 52-week range — near the bottom of that span. The high was set 363 sessions ago, whereas the low is far more recent at 81 sessions back. The 52-week low of 0.0128 sits below even the 60-day low of 0.0167, so the year’s trough was carved outside the recent two-to-three-month window. Over the past 20 sessions the swing runs from 0.0181 to 0.0259, and the current price sits just above that short-term low, while the wider 60-day range spans 0.0167 to 0.0365.
The weekly chart is in a downtrend, with price below the 20-week average and the 20-week below the 50-week. It sits 8.04% under the 20-week SMA at 0.0199 and 28.79% under the 50-week at 0.0257, and last week closed down 8.5%. Weekly RSI(14) is 42.1, above the daily 31.7, so momentum looks less stretched on the higher timeframe. The two timeframes agree that price trades beneath its longer-term averages, though the daily short-term structure reads as mixed rather than the cleaner weekly downtrend.
Over the past year GRTUSD is down 72.4%. The trailing quarter is net positive at +30.71%, but that stands against a -31.72% month and a -5.18% week; among the horizons shown, the month is the steepest fall and the quarter the only gain.
Descriptive technical summary generated by the ForexBullion Research Team from our own price feed. Not investment advice.