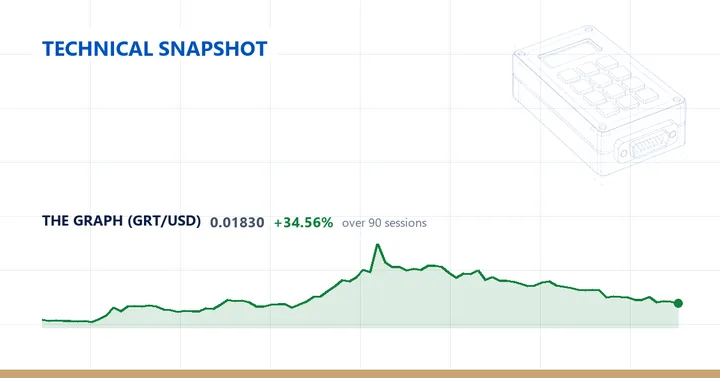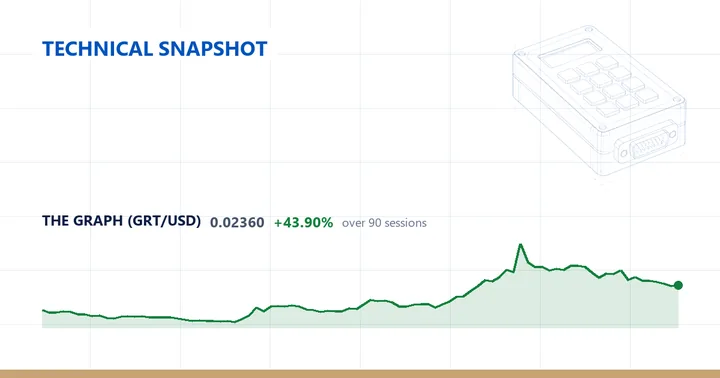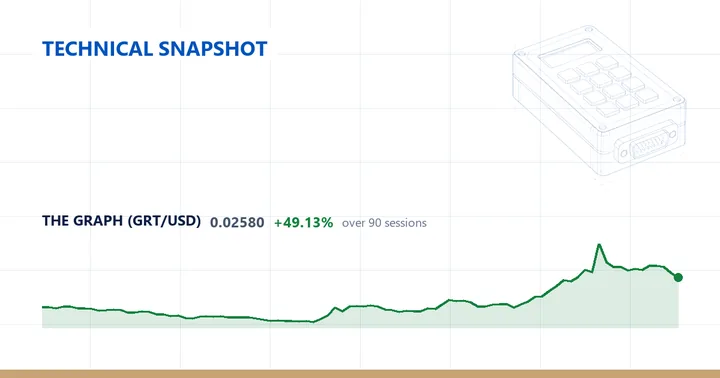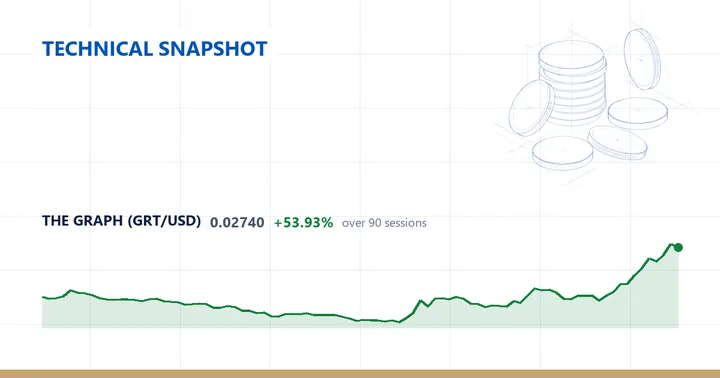

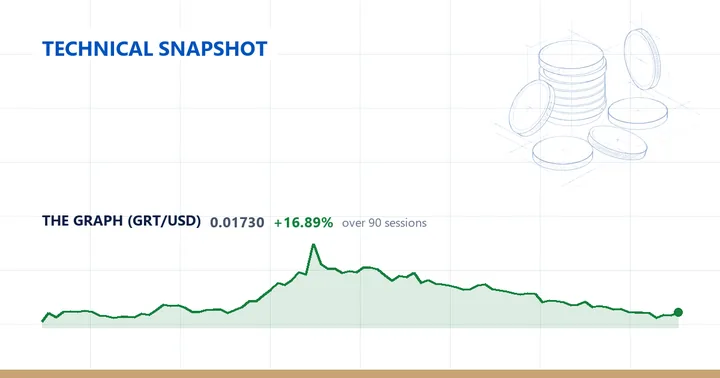
GRTUSD last traded at 0.0173, up 4.85% on the session.
The daily trend reads as below the 200-day average but with a mixed short-term structure. Price sits 5.98% under the 20-day average at 0.0184, 24.12% under the 50-day at 0.0228 and 15.2% under the 200-day at 0.0204 — the gap to the 50-day is the widest of the three. The 50-day is the highest of the averages and still prints above the 200-day, while the 20-day has slipped beneath both, leaving all three lines above the current price.
Momentum and volatility
The 14-day RSI reads 37.0, a neutral value within the 30-70 band and toward its lower half. Average true range over the same window is 0.0014, or 8.09% of the 0.0173 price. Measured against GRTUSD’s own trailing twelve months, that ATR sits at the 37th percentile, placing current daily volatility in the lower-middle of its own yearly range rather than at an extreme.
Range and weekly structure
Price is 70.43% below the 52-week high of 0.0585 and 35.16% above the 52-week low of 0.0128, which places it at the 10th percentile of its one-year range and nearer the low than the high. The high was set 362 sessions ago, while the low was printed more recently, 90 sessions back. Over the past 20 sessions the swing high is 0.0225 and the swing low 0.0153, and the current 0.0173 sits between the two. Widening to 60 sessions lifts the swing high to 0.0365 against the same 0.0153 swing low; because the 20- and 60-day swing lows match, that trough was itself set within the last 20 sessions.
On the weekly chart the structure is a downtrend, with price below the 20-week average and the 20-week below the 50-week. Price is 12.18% under the 20-week at 0.0197 and 29.39% under the 50-week at 0.0245, the weekly RSI reads 42.0, and the last weekly bar closed up 3.59%. The weekly RSI sits above the daily reading of 37.0, though both hold below the 50 midline. That weekly frame is more uniformly lower than the daily one, whose short-term structure is mixed rather than consistently down; the two timeframes agree that price trades beneath its longer averages but differ on the near-term read.
Over the past year GRTUSD is down 69.33% and off 26.69% over the past month; that monthly decline sits inside a trailing quarter that is still 25.36% higher, while the week is flat at 0.0%.
Descriptive technical summary generated by the ForexBullion Research Team from our own price feed. Not investment advice.