
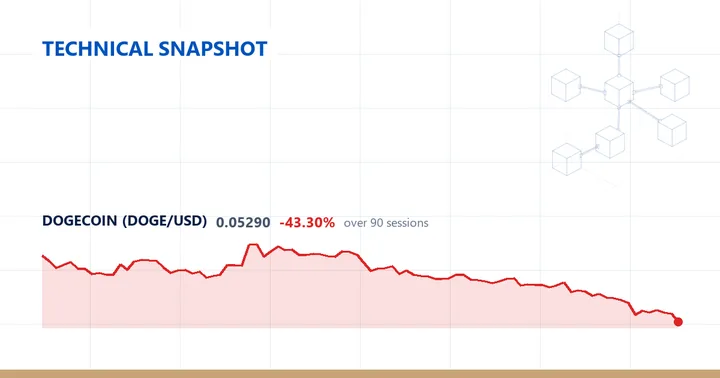
Dogecoin (DOGUSD) last traded at $0.0529, down 8.79% on the session, a drop that carried price to a fresh 52-week low.
The trend reads as a downtrend, with price below the 50-day average and the 50-day below the 200-day. All three tracked averages sit above spot and ascend with their lookback: the 20-day at 0.0662, the 50-day at 0.0761 and the 200-day at 0.0828. The gap to each widens accordingly, from 20.09% below the 20-day to 30.49% below the 50-day and 36.11% below the 200-day — the stacked, descending alignment that defines the structure.
Momentum, volatility and range
Daily RSI(14) is 22.1, a depressed reading (≤30, the zone often described as oversold). The 14-day ATR is 0.0039, equal to 7.37% of the 0.0529 price. Set against Dogecoin’s own past year, that ATR falls in the 20th percentile, toward the low end of the daily range the instrument has carried over the trailing twelve months. Today’s 8.79% decline is itself wider than that 7.37% average-range share, so the session’s range ran above the recent norm.
Price is 66.23% below the 52-week high of 0.15666, an extreme set 359 sessions ago, and 2.32% above the 52-week low of 0.0517, which was printed this session; the range’s upper bound dates back the better part of a year while its lower bound is current, and the 0.0529 close sits just above that intraday low. range_position_pct is 1, placing price at the very bottom of its 12-month band. The 20-day swing spans 0.0517 to 0.0781 and the 60-day swing 0.0517 to 0.1057; the floor of both windows is the same 0.0517 now matching the 52-week low, while the ceiling has stepped down from 0.1057 over 60 days to 0.0781 over 20. This is the third consecutive lower close.
Weekly picture
The weekly timeframe agrees with the daily. It too reads as a downtrend — price below the 20-week average, the 20-week below the 50-week — with price 31.83% below the 20-week (0.0776) and 43.12% below the 50-week (0.093). The last completed week closed down 11.24%. Weekly RSI(14) is 31.2, sitting just above the ≤30 line the daily reading of 22.1 has already fallen through, so both horizons lean the same way while the daily momentum is the more depressed of the two.
The performance ladder is negative across every horizon: down 7.36% on the week, 32.61% on the month, 42.31% on the quarter and 62.26% over the trailing year.
Descriptive technical summary generated by the ForexBullion Research Team from our own price feed. Not investment advice.