
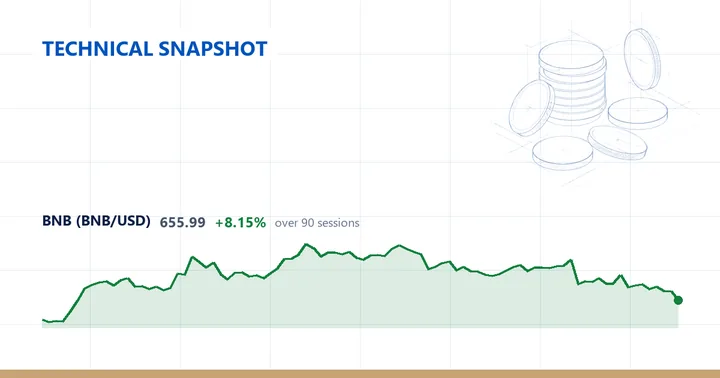
BNB (BNBUSD) last changed hands at 655.99, down 3.36% on the session and extending a run of three consecutive lower closes.
Trend
The daily read is below the 200-day average but with a mixed short-term structure. At 655.99 price sits just 0.27% under its 200-day line of 657.80 — effectively on it — yet trades 7.06% below the 20-day average of 705.85 and 10.66% below the 50-day average of 734.24. With the 20-day itself beneath the 50-day, the near-term averages stack below the long-term one, the signature of a market that has slipped from higher levels back toward its yearly mean.
Momentum and volatility
RSI(14) reads 32.2, sitting at the lower edge of the neutral 30–70 band and close to the oversold threshold. The 14-day ATR is 22.90, equal to 3.49% of price. Measured against BNB’s own trailing year, that reading lands at the 46th percentile — just below the midpoint — so the current daily swing is close to typical for this instrument rather than stretched or compressed.
Price sits 31.58% below the 52-week high of 958.71 and 22.43% above the 52-week low of 535.81, which places it at the 28th percentile of its 52-week range — in the lower third. That high was set 299 sessions ago and the low 134 sessions ago, so the more recent of the two extremes is the floor rather than the ceiling. Over the past 20 sessions price has held between a swing high of 761.29 and a swing low of 648.77; the 60-day swing low is the same 648.77, beneath a 60-day swing high of 809.16, leaving the 655.99 last print just above that shared floor.
On the weekly timeframe the trend is a downtrend, with price below the 20-week average and the 20-week below the 50-week. Price is 3.22% under the 20-week line of 677.82 and 4.91% under the 50-week of 689.87, and the latest week closed down 4.14%. The weekly RSI(14) is 43.5 — higher and more mid-band than the daily 32.2. The two timeframes broadly agree that price trades beneath its medium-term averages; they part only at the long end, where the daily close rests right on the 200-day line while the weekly structure stays firmly below its own 50-week average.
Across other windows BNB is down 5.32% over the past week and 10.06% over the past month, while the quarter is still positive at up 8.1%.
Over the trailing twelve months the instrument is down 29.18%.
Descriptive technical summary generated by the ForexBullion Research Team from our own price feed. Not investment advice.