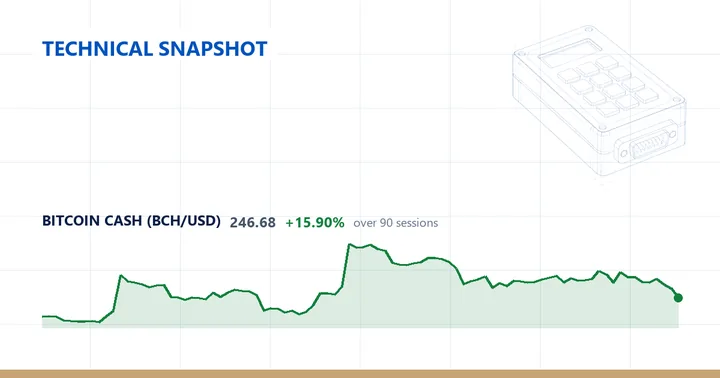
Bitcoin Cash (BCHUSD) last traded at 246.68, down 6.25% on the session.
Daily structure
Price sits below all three tracked moving averages: 11.46% beneath the 20-day at 278.60, 15.0% beneath the 50-day at 290.21, and 11.3% beneath the 200-day at 278.10, so the 200-day is the nearest average overhead and the 50-day the furthest. Our feed describes the setup as “below the 200-day average but with a mixed short-term structure,” and the averages bear that out — the 20-day, at 278.60, is only fractionally above the 200-day at 278.10, while the 50-day at 290.21 stands above both, leaving the shorter averages without a clean stack. The three averages themselves cluster between 278.10 and 290.21, a tight band that price sits below on all counts.
RSI(14) reads 35.5, inside the neutral 30–70 band and toward its lower edge, nearer the 30 line than the 70 line. The 14-day ATR is 17.07, equal to 6.92% of the 246.68 price. Measured against Bitcoin Cash’s own past year, that volatility sits at the 44th percentile — near the middle of its twelve-month range rather than unusually high or unusually quiet.
On range, price holds 63.09% below the 52-week high of 668.35 and 36.62% above the 52-week low of 180.56, placing it at the 14th percentile of its 52-week range, the lower end of the past year’s span. That high was set roughly 306 sessions ago, whereas the low is more recent at 136 sessions back. Across the past 20 sessions price has moved between a swing high of 304.25 and a swing low of 243.33, and the current 246.68 sits just above that 20-day floor and well above the 60-day swing low of 212.36; the 60-day swing high stands at 365.40. Today’s print extends the run to three consecutive lower closes.
Weekly view
On the weekly chart the structure is a downtrend: price trades below the 20-week average and the 20-week sits below the 50-week. Price is 1.49% under the 20-week at 250.40 and 35.52% under the 50-week at 382.56, while the weekly RSI(14) stands at 42.7 — higher than the daily reading but still below the midpoint. The latest week closed 13.13% lower. On this the two timeframes agree: the weekly downtrend lines up with a daily chart that also has price beneath every tracked average.
Across timeframes the record is mixed: BCHUSD is down 13.13% over the past week and 10.63% over the past month, yet up 15.10% across the quarter, while the trailing year shows a 50.21% decline. The quarter is the only positive window of the four, and that 50.21% yearly fall the deepest reading among them.
Descriptive technical summary generated by the ForexBullion Research Team from our own price feed. Not investment advice.