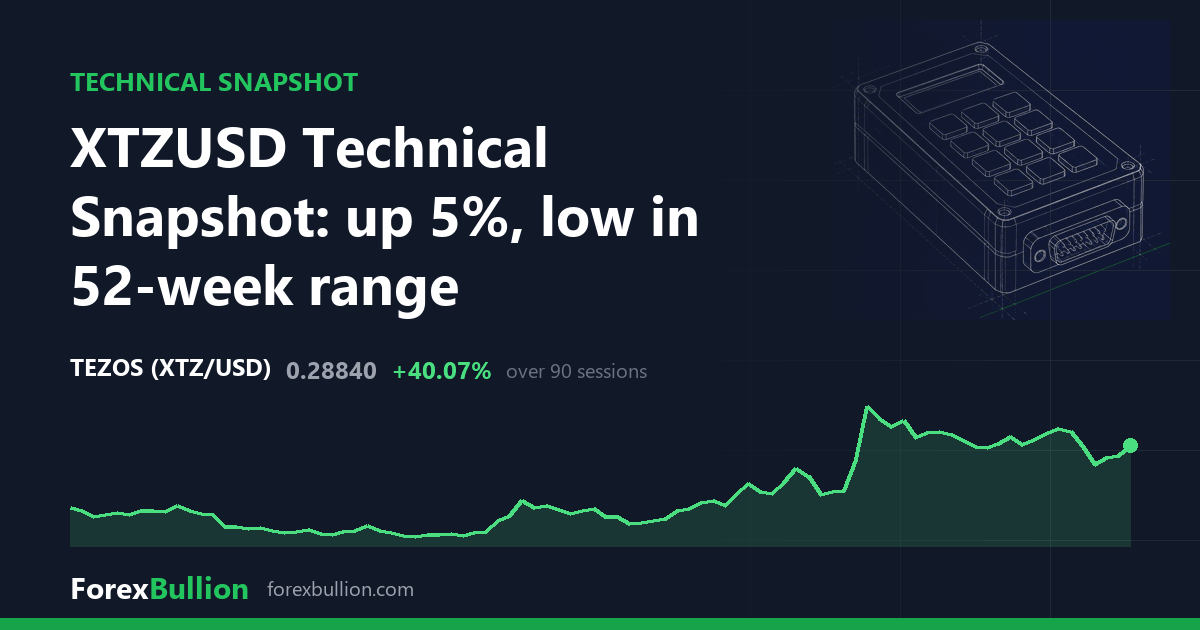
XTZUSD, a crypto CFD, traded at 0.2884, up 5.06% on the session.
The trend reads as above the 200-day average but with a mixed short-term structure. Price is 7.05% above the 200-day line at 0.2694 and 13.86% above the 50-day at 0.2533, but 1.97% below the 20-day at 0.2942. The 50-day average sits below the 200-day, so the two longer gauges are not aligned, and price has recovered above both while remaining under the shortest average.
Momentum and volatility
RSI(14) stands at 53.3, a neutral reading inside the 30-70 band. The 14-day ATR is 0.0207, equal to 7.18% of the 0.2884 price. That ATR falls at the 52nd percentile of the past year, so daily movement sits almost exactly at the midpoint of its own twelve-month range — neither stretched nor unusually quiet relative to how XTZUSD has behaved.
Price is 61.33% below the 52-week high of 0.74586 and 74.47% above the 52-week low of 0.1653, giving a 52-week range position of 21 on a 0-100 scale — the lower fifth of the span. That high was set 337 sessions ago, while the low was made far more recently, 60 sessions back. Over the past 20 sessions price has moved between a swing low of 0.2535 and a swing high of 0.3255, leaving the last price between the two; the wider 60-day band runs from a low of 0.1659 to a high of 0.3717. The 20-session high of 0.3255 is lower than the 60-session high of 0.3717, while the 20-session low of 0.2535 sits well above the 60-session low of 0.1659. That 60-day low of 0.1659 is effectively the 52-week low, whereas the 60-day high of 0.3717 remains far beneath the 52-week high. The tape shows 3 consecutive higher closes.
Weekly picture
The weekly read is below the 50-week average but with a mixed short-term structure. Price is 23.46% above the 20-week average at 0.2336 yet 19.33% below the 50-week average at 0.3575, and the most recent weekly bar closed down 5.13%. The 20-week average sits below the 50-week average, echoing the daily chart where the 50-day lies under the 200-day. Weekly RSI(14) is 50.2, a shade more subdued than the daily 53.3. The timeframes disagree: the daily chart has price above its 200-day line, while the weekly chart holds it below its 50-week line.
Over longer windows the record is split — XTZUSD is up 48.05% on the quarter and 20.32% on the month, yet down 7.09% on the week and 54.24% across the year, so recent monthly and quarterly gains stand against a year that remains deeply negative.
Descriptive technical summary generated by the ForexBullion Research Team from our own price feed. Not investment advice.




