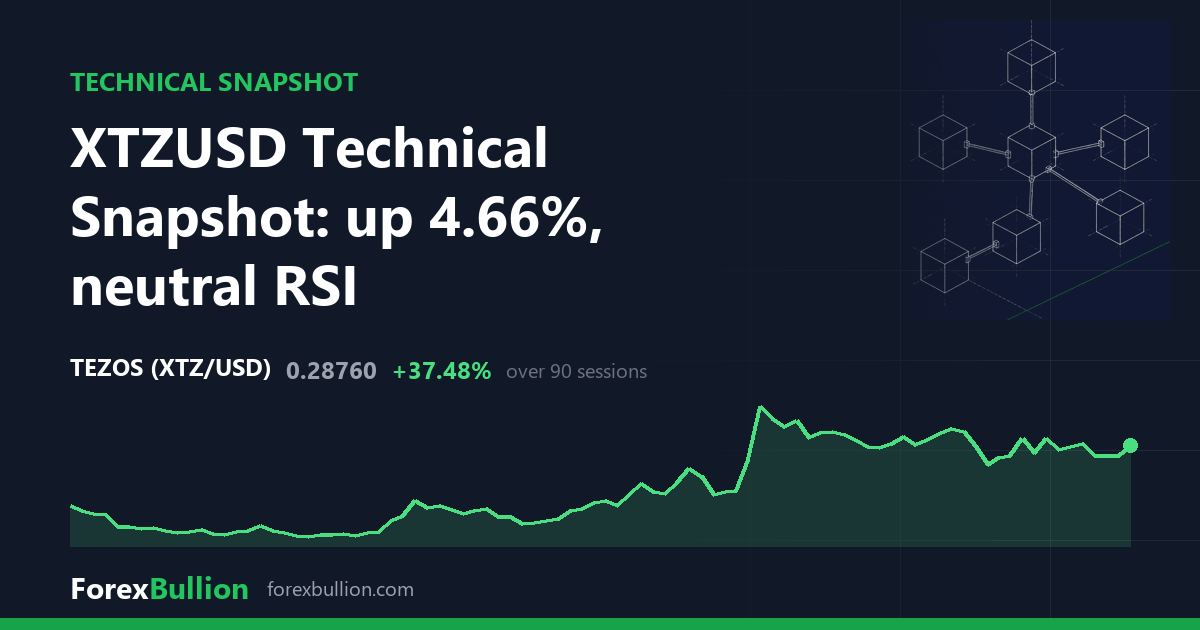
XTZUSD last changed hands at 0.2876, up 4.66% on the session, with the read drawn from 401 daily bars.
Trend and momentum
The daily trend reads as an uptrend: price sits above the 50-day average and the 50-day above the 200-day. Spot is barely clear of the 20-day line, only 0.1% above it at 0.2873, so the short average and current price are effectively level. Further out the gap widens — price is 6.95% above the 50-day at 0.2689 and 7.92% above the 200-day at 0.2665. The 50-day and 200-day are themselves clustered close together, the shorter only fractionally above the longer, so both long averages sit well beneath spot.
RSI(14) reads 52.4, inside the neutral 30-70 band and close to the midline. ATR(14) is 0.0233 in price terms, equal to 8.1% of the 0.2876 price. Measured against XTZUSD’s own trailing twelve months, that ATR sits at the 57th percentile — modestly above the median, so recent daily range is a little wider than a typical session of the past year without being extreme.
Range, weekly and performance
Against its yearly range, price is 61.44% below the 52-week high of 0.74586 and 73.99% above the 52-week low of 0.1653, leaving it at roughly 21% of the 52-week span — nearer the floor than the ceiling. The two extremes were set far apart in time: the high is 346 sessions back, nearly a year ago, while the low is far more recent at 69 sessions. Nearer term, the 20-day swing runs from 0.2535 to 0.324 and the wider 60-day range from 0.1816 to 0.3717; at 0.2876 the last price sits just below the midpoint of that 20-day swing and a little above the middle of the 60-day band.
The weekly timeframe, built from 58 bars, is less uniform. Its trend reads as below the 50-week average but with a mixed short-term structure: price is 23.17% above the 20-week average at 0.2335 yet 16.59% below the 50-week average at 0.3448. This is where the two timeframes diverge — the daily chart holds above both its 50- and 200-day lines in an uptrend, while the weekly still trades beneath its 50-week line. The 20-week average, at 0.2335, lies below even the daily 200-day of 0.2665, underscoring how much lower the weekly structure is anchored. Weekly RSI(14) is 49.7, just under its midline, and the most recent week closed up 4.66%.
Over the trailing windows XTZUSD is up 1.52% on the week and 42.87% on the quarter, but down 8.32% over the month and 50.97% across the past year.
Descriptive technical summary generated by the ForexBullion Research Team from our own price feed. Not investment advice.