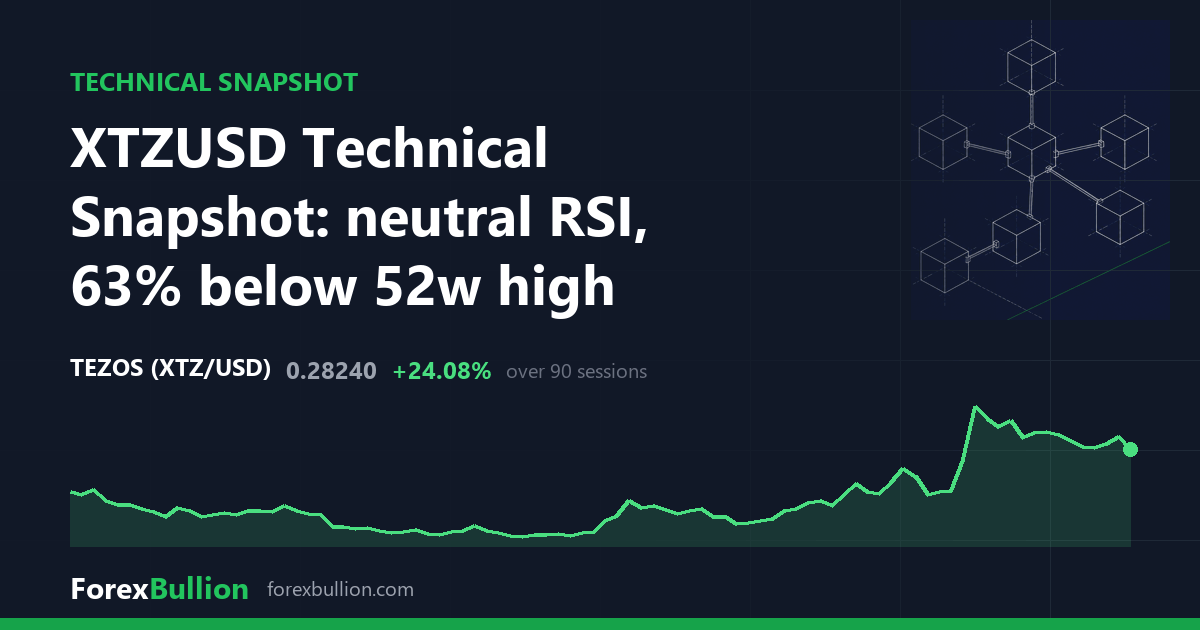
XTZUSD, the Tezos CFD, last changed hands at 0.2824, down 5.74% on the session.
Trend and moving averages
The daily picture is above the 200-day average but with a mixed short-term structure. Price holds 3.07% above its 200-day average at 0.274 and 20.43% above the 50-day at 0.2345, yet sits 0.98% below the 20-day at 0.2852. The 50-day average at 0.2345 is the lowest of the three, beneath both the 20-day at 0.2852 and the 200-day at 0.274, and today’s 0.2824 falls just under the 20-day while staying clear of the 50-day.
Momentum is neutral: the 14-day RSI reads 53.9, within the 30-70 band. The 14-day ATR is 0.022, equal to 7.79% of the 0.2824 price — a wide daily range for a sub-0.30 quote. Against the instrument’s own trailing year that ATR sits at the 53rd percentile, marginally above the midpoint of the daily ranges XTZUSD has recorded over the past twelve months, so current volatility is neither compressed nor extreme.
Range and the weekly view
Price is 63.68% below the 52-week high of 0.77763 and 70.84% above the 52-week low of 0.1653, leaving it at the 19th percentile of that 52-week span — the lower fifth of the yearly range. Within shorter windows, the 20-day swing runs from 0.2139 to 0.3717 and the 60-day swing from 0.1653 to 0.3717; the two share the same 0.3717 high, and the 60-day low coincides with the 52-week low. At 0.2824 the last price sits above the 20-day swing low of 0.2139 but below both swing highs at 0.3717. The 52-week low was set 51 sessions ago, whereas the 52-week high dates back 362 sessions.
On the weekly timeframe the trend is below the 50-week average but with a mixed short-term structure. Price sits 20.27% above the 20-week average of 0.2348 and 22.33% below the 50-week average of 0.3636; the 20-week line itself sits below the 50-week in an inverted stack, and that 20-week average of 0.2348 nearly matches the daily 50-day average of 0.2345. The weekly RSI is 49.6, just under the 50 mark and a touch below the daily RSI of 53.9, with both inside neutral territory. The most recent weekly bar closed down 4.27%. The timeframes only partly align: the daily keeps price above its 200-day average while the weekly holds below its 50-week average — a split on the longer references, even as both carry the same mixed short-term structure.
Shorter horizons are firmer than the year: price is up 39.46% over the past month and 32.46% over the past quarter, even as the trailing week shows -6.71%.
Over the trailing year XTZUSD is down 60.7%.
Descriptive technical summary generated by the ForexBullion Research Team from our own price feed. Not investment advice.




