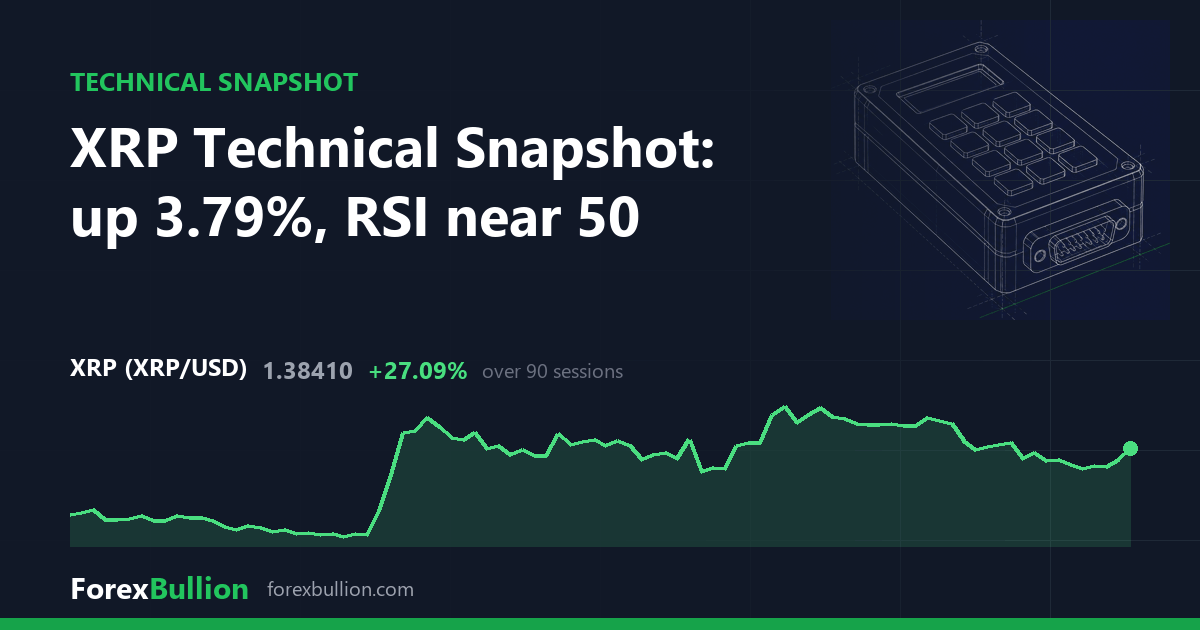
XRP (XRPUSD) last traded at 1.3841, a session move of +3.79%.
On the daily chart XRP sits above the 200-day average but with a mixed short-term structure. It is 8.2% above the 200-day line at 1.2792 — the only one of the three averages below price — while both shorter averages sit overhead: 0.35% above price at the 20-day (1.3889) and 2.02% at the 50-day (1.4126). Those two short averages are themselves close, so the near-term alignment is flat even as the distance above the 200-day stays clear.
RSI(14) reads 50.3, inside the neutral 30-70 band and almost exactly at its midpoint — momentum is neither stretched nor washed out. ATR(14) is 0.0628, equal to 4.54% of the last price. Measured against XRP’s own trailing year, that reading sits at the 40th percentile, in the lower half of the daily ranges recorded over the past twelve months — day-to-day movement is running toward the quieter end of its yearly range rather than in a high-volatility phase.
Within its wider range, price is 48.68% below the 52-week high of 2.6969 and 40.36% above the 52-week low of 0.9861, leaving it 23% of the way up that 52-week band — the lower quarter of its yearly range. The two extremes are far apart in time: the high is 359 sessions back, near the start of the 401-bar daily sample, while the low is more recent at 68 sessions ago. Closer in, the 20-day swing spans 1.2536 to 1.5535 and the 60-day swing 1.2468 to 1.6571; the two swing lows cluster just under 1.25 while the 60-day high marks the three-month ceiling, and current price lies inside both. The last two sessions have closed higher — a run of 2 consecutive higher closes.
Weekly picture
Across 58 weekly bars, the weekly chart is below the 50-week average but with a mixed short-term structure of its own. Price is 10.35% above the 20-week average at 1.2543 and 5.97% below the 50-week average at 1.4720 — the 20-week gap being the widest distance to any average across both timeframes. The weekly RSI(14) is 49.7, again right at the midpoint, and last week closed up 6.09%. The two timeframes disagree on the longer trend: daily sits above its 200-day average while weekly sits below its 50-week average. They agree on the near term, both reading as mixed with RSI near 50.
Over longer horizons XRP shows a quarter up 25.1% and a week up 3.87%, set against a month down 11.95% and a year down 41.47% — the past three months the one positive window in an otherwise negative year.
Descriptive technical summary generated by the ForexBullion Research Team from our own price feed. Not investment advice.