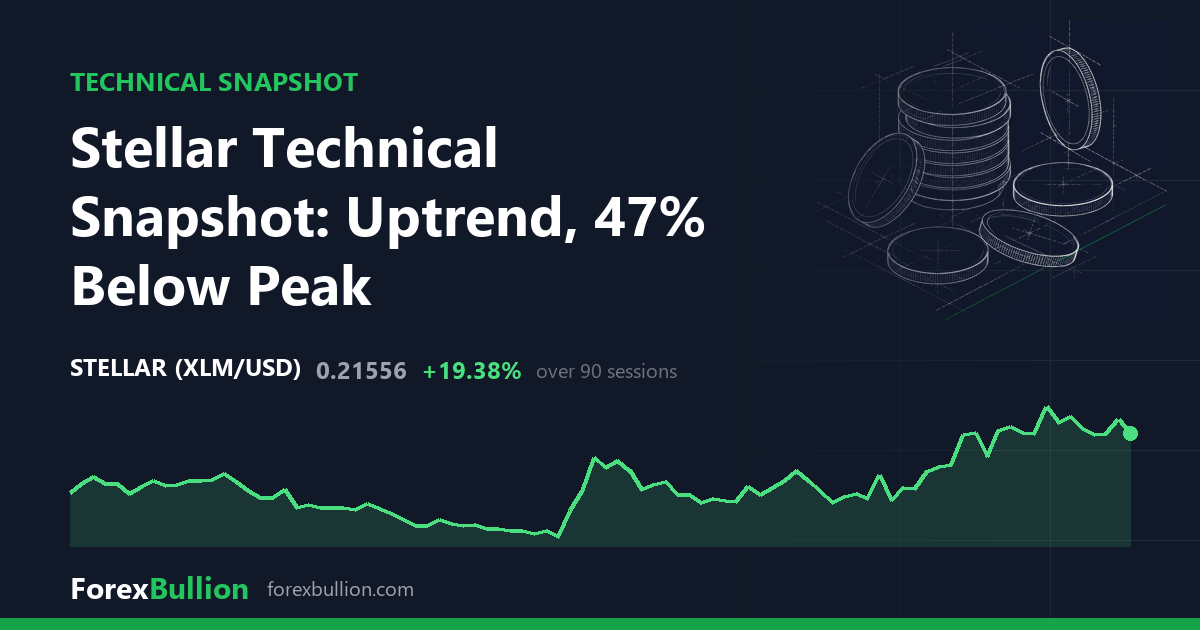
Stellar (XLMUSD) last traded at $0.21556, down 3.61% on the session.
Drawn from 401 daily bars, the daily structure reads as an uptrend, with price above the 50-day average and the 50-day sitting above the 200-day. The last price is 2.11% above its 20-day SMA ($0.2111), 11.57% above the 50-day ($0.1932) and 19.36% above the 200-day ($0.1806), so price holds above all three averages with the separation widening from the shortest to the longest.
RSI(14) is 55.1, a neutral reading inside the 30-70 band. The 14-day ATR is $0.0136, equal to 6.31% of the current price. Measured against the instrument’s own past year, that ATR sits in the 65th percentile, so recent daily ranges are wider than roughly two-thirds of the sessions seen over the trailing twelve months.
Within its 52-week range, price is 47.44% below the high of $0.41012 and 58.57% above the low of $0.13594, which places it at the 29th percentile of that range. The high was set 363 sessions ago and the low 241 sessions ago, so both extremes are many months behind the current market. That distance below the high, 47.44%, is close to the trailing-year return of -47.21%, consistent with the peak having formed about a year back. Closer in, the $0.21556 last price sits between the 20-day swing low of $0.172 and the 20-day swing high of $0.23656, with the 60-day swing high matching that same $0.23656 and the 60-day swing low deeper at $0.15203; the higher 20-day floor relative to the 60-day one marks a base that has lifted over the past month.
Built from 59 weekly bars, the weekly trend reads as above the 50-week average but with a mixed short-term structure. Price is 11.17% above the 20-week SMA ($0.1939) and 10.83% above the 50-week ($0.1945), and those two weekly averages are almost level, with the 20-week fractionally below the 50-week. Weekly RSI(14) is 54.5, close to the daily 55.1, and the last week closed down 3.61%. The weekly read broadly agrees with the daily uptrend in that price holds above its longer averages, but the near-flat 20- and 50-week lines point to a flatter medium-term backdrop than the clearly rising stack of daily averages.
Over the trailing year XLMUSD is down 47.21%, while shorter windows diverge: the past week is off 2.85%, the month is up 15.04% and the quarter up 14.67% — the month’s gain exceeding the quarter’s puts that advance within the most recent month.
Descriptive technical summary generated by the ForexBullion Research Team from our own price feed. Not investment advice.




