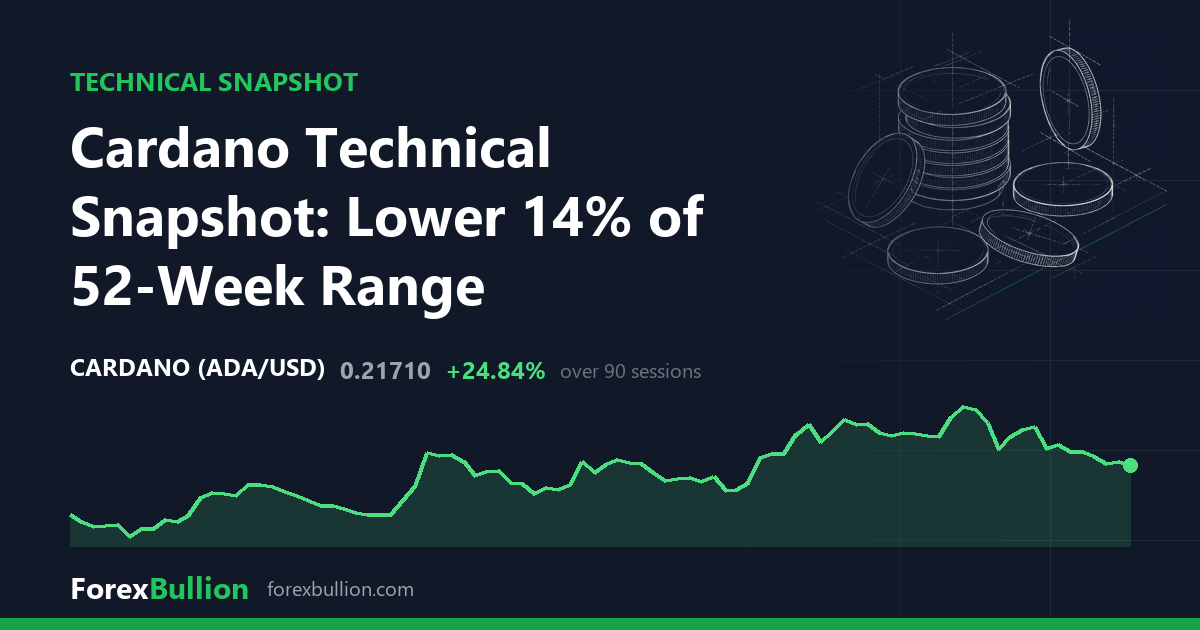
Platinum (XPTUSD), a metal CFD, last traded at 1691.69, up 2.38% on the session.
Trend and moving averages
The daily structure is a downtrend: price sits below the 50-day and the 50-day sits below the 200-day. At 1691.69 the metal is 2.85% below its 20-day average (1741.285), 5.08% below the 50-day (1782.226) and 9.19% below the 200-day (1862.84), the three averages stacked in descending order from short to long and the distance widening the further out the average runs. The session’s 2.38% rise is the second of 2 consecutive higher closes, and even after it price remains beneath all three averages, the nearest being the 20-day, 2.85% overhead.
Momentum, volatility and range
Momentum reads neutral: the 14-day RSI is 43.2, inside the 30-70 band and below the 50 midline. Volatility is compressed — the 14-day ATR is 51.46, equal to 3.04% of price, and that reading sits in the 9th percentile of the past twelve months, among the narrowest daily ranges the instrument has registered over that span.
Within its longer range the metal is 42.05% below the 52-week high of 2919.36 and 13.68% above the 52-week low of 1488.09, which places it 14% of the way up its 52-week band, toward the lower end. The high was set 218 sessions ago and the low 300 sessions ago, so neither extreme is recent. Closer in, the 20-day swing runs from a 1607.14 low to an 1849.71 high, while the 60-day range shares that same 1607.14 floor but reaches higher, to 1935.23. The matching 20-day and 60-day lows show no fresh low has printed in the last twenty sessions, and at 1691.69 price holds in the lower half of the 20-day band, above the shared floor and below both swing highs. Even the 60-day high of 1935.23 sits well under the 52-week peak of 2919.36, so the recent two-month range has held far below the year’s top.
The weekly frame agrees with the daily. It is also a downtrend — price below the 20-week average and the 20-week below the 50-week — with price 2.43% under the 20-week (1733.7525) and 10.75% under the 50-week (1895.5368). That weekly 20-week sits almost exactly where the daily 20-day (1741.285) does, so the nearest overhead average lands at the same level on both timeframes. The weekly 14-day RSI is 43.8, within a point of its daily counterpart and likewise neutral, and the prior week closed -0.74%.
Over longer windows the instrument is up 6.38% on the year and 3.64% on the quarter, set against -5.01% over the past month and -0.26% on the week — a year-and-quarter gain coexisting with a weaker trailing month.
Descriptive technical summary generated by the ForexBullion Research Team from our own price feed. Not investment advice.