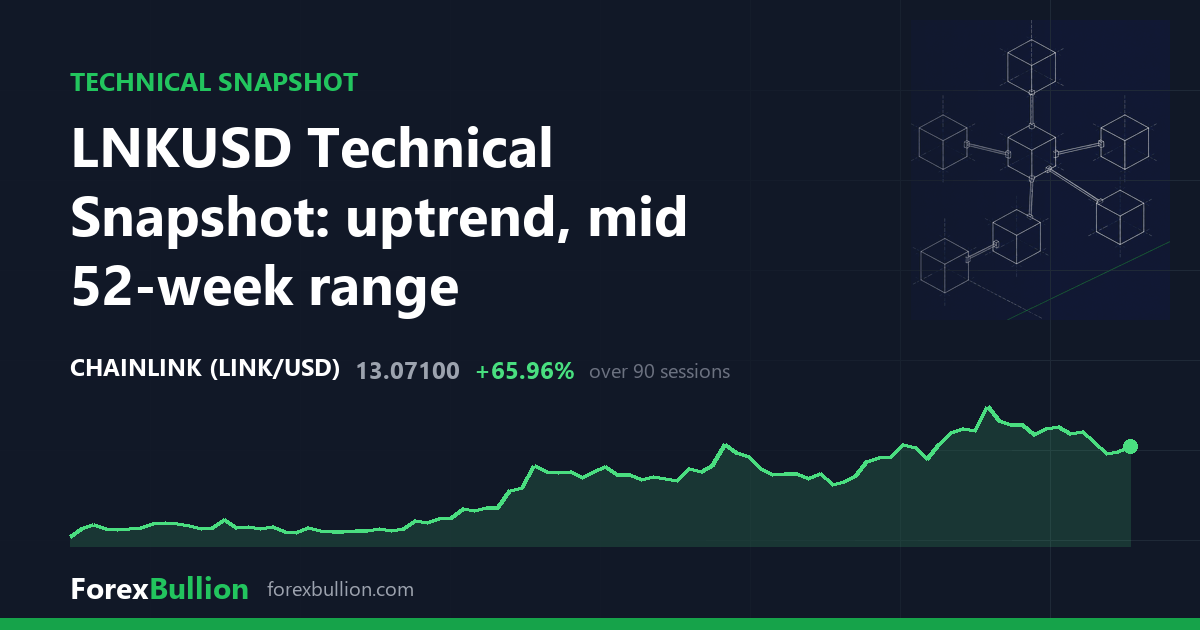
LNKUSD last traded at 13.071, up 2.22% on the latest session.
Trend and momentum
The daily read is an uptrend: price holds above the 50-day average, which in turn sits above the 200-day. Spot is 4.56% above the 50-day line at 12.5013 and a wide 35.03% above the 200-day at 9.6798, a gap that measures how far the market has climbed from its longer-term base. The nearer term is softer — price is 4.74% below the 20-day average at 13.7211, so the fastest of the three averages now sits above the market even while the two slower ones sit below it. The figures are drawn from 401 daily bars.
RSI(14) reads 49.1, a neutral value sitting almost exactly at the midpoint of the 30-70 band, neither stretched nor washed out. The 14-day ATR is 0.7461, equal to 5.71% of the 13.071 price. Measured against the instrument’s own last twelve months, that ATR falls in the 73rd percentile — toward the upper end of the daily volatility this market has shown over the year.
Range and timeframes
Price sits 35.28% below the 52-week high of 20.196 and 87.08% above the 52-week low of 6.987, placing it at the 46th percentile of its 52-week range, just under the midpoint. The high is old, set about 362 sessions ago, whereas the low is far more recent at roughly 126 sessions back. Over the past 20 sessions the market has held between a swing low of 12.049 and a swing high of 15.757; the 60-day window keeps that same 15.757 high but drops to a swing low of 8.606, and because both windows share the 15.757 peak, that high was set within the last 20 sessions. The 60-day swing low of 8.606 also sits above the 52-week low of 6.987. The two most recent sessions have both closed higher.
On the weekly chart, built from 58 weekly bars, price stands above its 50-week average in what is described as a mixed short-term structure. Price is 30.5% above the 20-week average at 10.0161 and 23.22% above the 50-week at 10.6082, and the weekly RSI(14) is 58.2 — firmer than the 49.1 neutral reading on the daily. The two timeframes agree on the broader uptrend, and both carry a near-term soft patch: price sits below its daily 20-day line while the latest week closed down 8.4%.
Over longer windows the record is split: price is up 63.67% over the quarter and 13.31% over the month but down 24.04% across the past year, so the advance is a recent one set against a weaker twelve-month backdrop.
Descriptive technical summary generated by the ForexBullion Research Team from our own price feed. Not investment advice.




