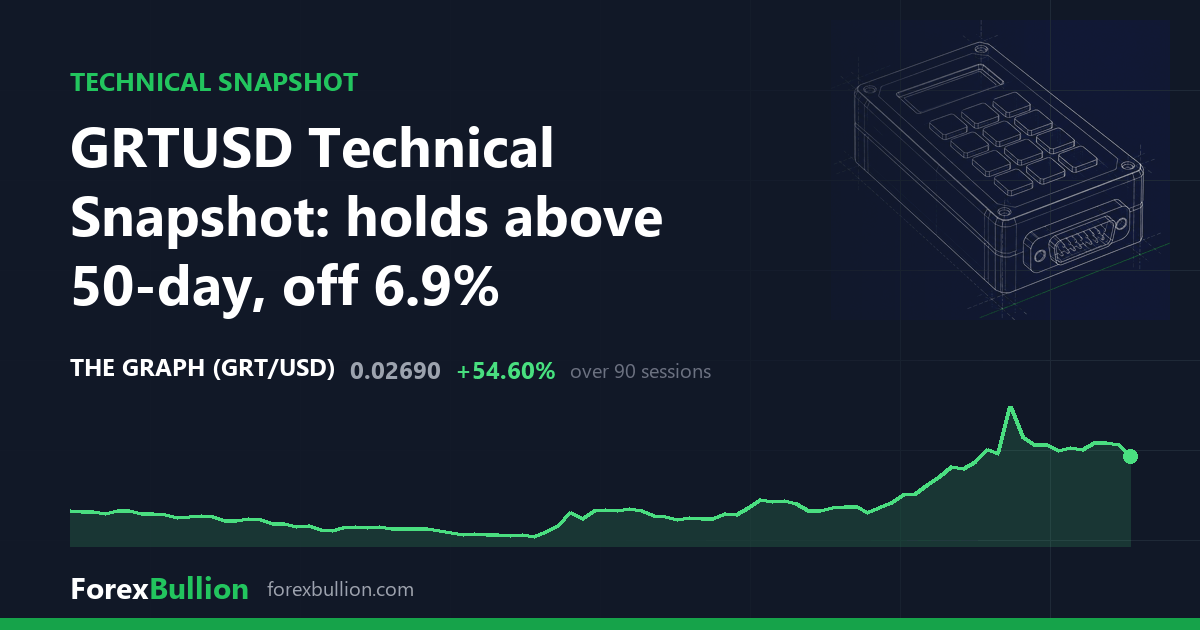
GRTUSD last changed hands at 0.0269, down 6.92% on the session.
Trend and moving averages
The daily structure reads as an uptrend — price sits above the 50-day, and the 50-day sits above the 200-day. At 0.0269 the market is 0.37% below the 20-day average of 0.027, effectively level with it, but 26.89% above the 50-day at 0.0212 and 28.1% above the 200-day at 0.021. The 20-day average of 0.027 runs above both longer lines, while the 50-day and 200-day are clustered almost on top of one another at 0.0212 and 0.021, so price trades well clear of a tight long-term base.
RSI(14) is 54.5, a neutral reading inside the 30–70 band. The 14-day ATR is 0.0022, equal to 8.18% of the current price — a wide daily range relative to the sub-penny quote. Measured against the instrument’s own past year, that ATR sits around the 60th percentile, a little above its median daily movement over the twelve months. Price has reached this reading on 3 consecutive lower closes.
Range and weekly picture
Price is 67.63% below the 52-week high of 0.0831 and 110.16% above the 52-week low of 0.0128, which places it at the 20th percentile of its 52-week range. That high was set 362 sessions ago, close to a year back, whereas the low is far more recent at 49 sessions. The 20-day swing runs from 0.0186 to 0.0365, and the 60-day swing high is also 0.0365 — so the two-month peak was made within the last twenty sessions. The 60-day swing low of 0.0128 matches the 52-week low, consistent with that trough dating to 49 sessions ago.
On the weekly chart the trend is below the 50-week average but with a mixed short-term structure. Price holds 35.18% above the 20-week average of 0.0199 yet sits 6.27% below the 50-week at 0.0287, and the 20-week average itself sits below the 50-week. The most recent week closed down 8.19%, and weekly RSI(14) is 52.6, also neutral. The two timeframes disagree: the daily read is an uptrend above both its 50- and 200-day averages, while the weekly still has price beneath its 50-week line.
Over the longer run the record is split. GRTUSD is up 40.1% over the past month and 56.4% over the quarter — gains built off the recent 52-week low — while it is down 3.58% over the past week and down 67.51% across the full year.
Descriptive technical summary generated by the ForexBullion Research Team from our own price feed. Not investment advice.




