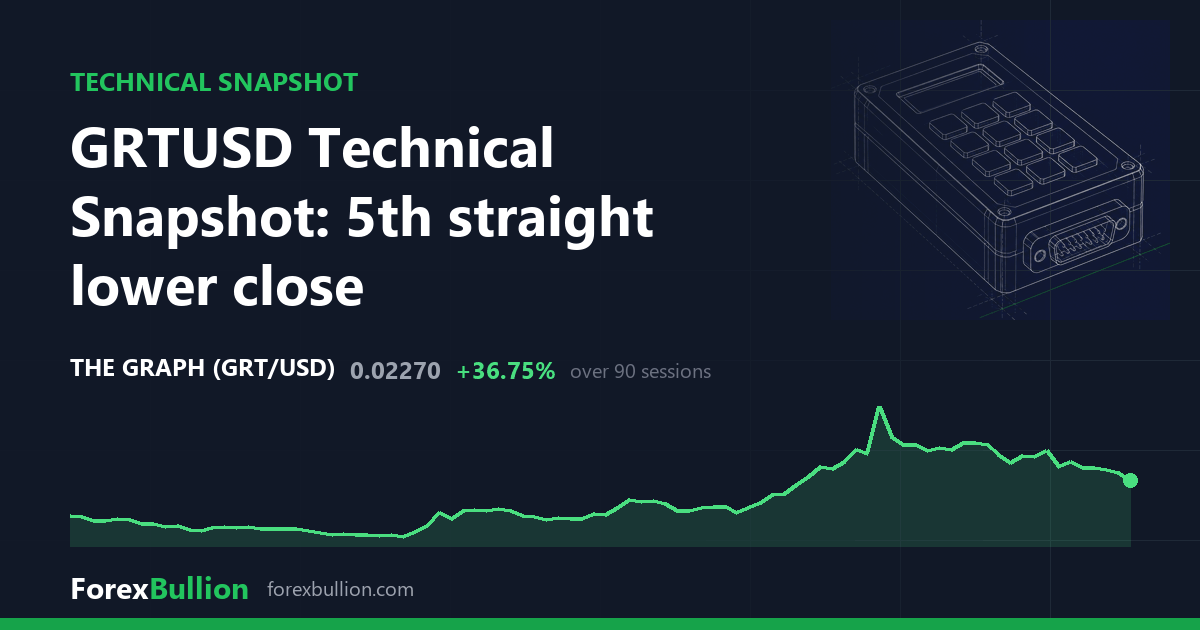
GRTUSD last traded at 0.0227, a drop of 5.81% on the session, and the read below draws on 401 daily bars and 58 weekly bars from our own feed.
Trend and momentum
The daily trend reads as above the 200-day average but with a mixed short-term structure. Price holds 7.58% above the 200-day line at 0.0211, the one longer-term average sitting beneath it, while the two shorter averages are overhead: the last price is 1.73% below the 50-day at 0.0231 and 15.61% below the 20-day at 0.0269, the widest of the three gaps. The averages themselves stack in descending order from short to long — 0.0269, then 0.0231, then 0.0211 — leaving price under the upper two and above the lowest.
RSI(14) stands at 40.6, a neutral reading inside the 30-70 band and below the 50 midline. ATR(14) is 0.002, equal to 8.81% of the 0.0227 price, a wide daily range in percentage terms at this level. Set against the instrument’s own past year, that ATR sits at the 57th percentile, a little above the twelve-month median rather than at either extreme.
Range and the weekly picture
Price sits 70.01% below the 52-week high of 0.0757 and 77.34% above the 52-week low of 0.0128, placing it at 16 on a 0-100 read of the 52-week range, toward the lower end. The two extremes were set far apart in time: the high was last touched 345 sessions ago, while the low is far more recent at 60 sessions back. Over the last 20 sessions the swing high is 0.0309 and the swing low 0.0225, leaving the 0.0227 last price just above that near-term low; across 60 sessions the band runs from a 0.0365 high down to a 0.0136 low, the latter sitting just above the 52-week low of 0.0128. The latest bar extends a run of 5 consecutive lower closes.
On the weekly chart the trend is below the 50-week average but with a mixed short-term structure. Price is 14.65% above the 20-week average at 0.0198 yet 18.64% below the 50-week at 0.0279, and the most recent week closed down 18.64%. Weekly RSI(14) is 47.0, also neutral and near its midline, a little above the daily 40.6. The two timeframes disagree: the daily chart keeps price above its 200-day average, while the weekly chart holds it below its 50-week average, making the longer horizon the weaker of the two.
Over the past year GRTUSD is down 64.48% and over the past week down 9.92%, against an 11.27% gain on the month and 38.41% on the quarter.
Descriptive technical summary generated by the ForexBullion Research Team from our own price feed. Not investment advice.




