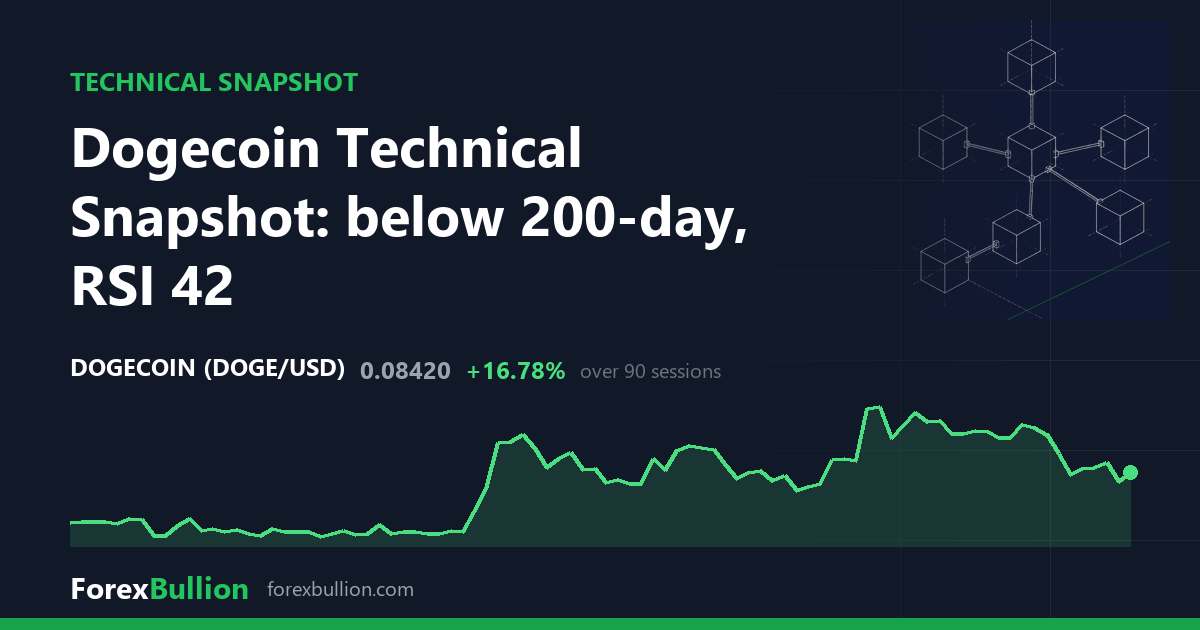
Dogecoin (DOGUSD) last traded at 0.0842, up 2.81% on the session.
The daily trend reads as below the 200-day average but with a mixed short-term structure. Price sits 3.66% under the 200-day average at 0.0874, 4.75% under the 50-day at 0.0884, and 7.88% under the 20-day at 0.0914, so the distance to each line widens as the average shortens. The three averages themselves are bunched within a narrow band, from 0.0874 up to 0.0914, with current price below all of them.
RSI(14) reads 42.2, inside the neutral 30–70 band and below the 50 midline. The 14-day ATR is 0.0048, equal to 5.7% of the 0.0842 price. Measured against its own past year, that ATR sits at the 39th percentile — below the midpoint of the last twelve months, which places recent daily ranges in the quieter half of the period rather than at an extreme.
Price is 59.82% below the 52-week high of 0.20955 and 24.93% above the 52-week low of 0.0674, a spread that leaves it at the 12th percentile of its 52-week range, firmly in the lower portion. That high was last touched 351 sessions ago, while the low is far more recent, set 73 sessions back. Within the most recent 20 sessions the market has traced a swing low of 0.0798 and a swing high of 0.0996, and the last price of 0.0842 lies in the lower third of that near-term span. The 20-day swing high of 0.0996 is itself below the 60-day swing high of 0.1057, so the most recent peak undercuts the two-month peak. Stretching to 60 sessions, the band widens to 0.0688 at the bottom and 0.1057 at the top, so price also holds above the lower 60-day extreme while remaining well under the upper one.
Weekly picture
On the weekly chart the trend reads below the 50-week average but with a mixed short-term structure. Price is 17.29% under the 50-week average of 0.1018, yet 3.19% above the 20-week average of 0.0816, and the weekly RSI(14) is 43.9. The latest weekly bar closed down 2.66%. The two timeframes agree on the broad backdrop — both hold price below their longest average — but diverge on the near term: price is above its 20-week average while sitting below its 20-day average. Both RSI readings, 42.2 daily and 43.9 weekly, sit below 50 in neutral territory.
Over the past year DOGUSD is down 58.81%, with the quarter up 14.09% and the month up 0.96%, against a trailing week down 5.18%.
Descriptive technical summary generated by the ForexBullion Research Team from our own price feed. Not investment advice.




