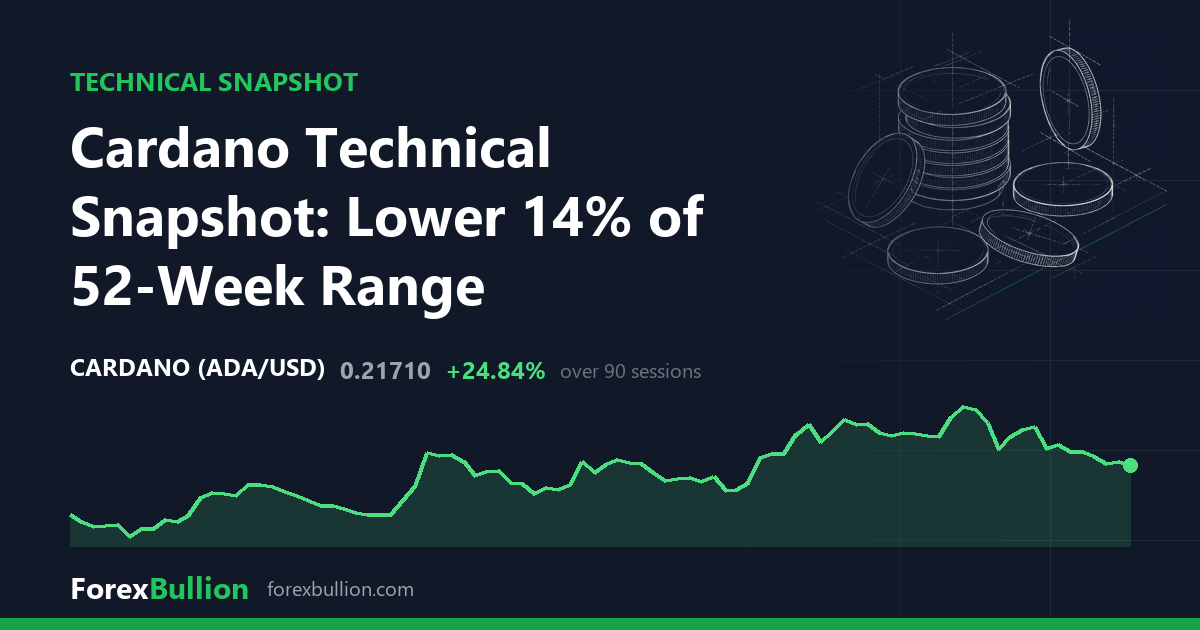
Cardano (ADAUSD) last traded at 0.2171, a decline of 1.59% on the session.
The trend sits above the 200-day average but with a mixed short-term structure. At 0.2171 the price is 2.55% above the 200-day line at 0.2117, the one major average it holds. It remains 5.32% below the 50-day at 0.2293 and 9.77% below the 20-day at 0.2406. Those averages stack in descending order — the 20-day above the 50-day above the 200-day — leaving the last price wedged between its 50-day and 200-day lines.
Momentum is neutral. The 14-day RSI reads 39.9, within the 30-70 band and in its lower half. Volatility, measured by the 14-day ATR, is 0.0151, equal to 6.96% of price — a broad daily range in percentage terms. Against the instrument’s own past year that ATR sits at the 49th percentile, almost exactly the midpoint of its twelve-month volatility range, so the current swing is neither unusually calm nor unusually stretched by its own standards.
Price is 68.68% below the 52-week high of 0.6931 and 57.32% above the 52-week low of 0.138, which places it at the 14th percentile of the 52-week range — in the lower band. The timing of those extremes differs sharply: the high was set 357 sessions ago, close to a year back, while the low came more recently, 116 sessions ago. Over the shorter windows, the 20-day swing runs from a low of 0.2105 to a high of 0.2819, and the 60-day swing from 0.1889 up to the same 0.2819. The matching highs show the two-month peak was made within the past month. The last price sits just above the 20-day swing low and well beneath the matching 0.2819 high, while the 60-day low of 0.1889 holds above the annual trough, so the past two months’ weakest print has stayed off the 52-week low.
Weekly picture
On the weekly bars the trend reads below the 50-week average but with a mixed short-term structure. Price is 8.6% above the 20-week average at 0.1999 yet 17.45% below the 50-week at 0.263, and the last week closed down 1.59%. The weekly RSI is 45.1 — higher than the daily 39.9 and closer to the middle of its band. The two timeframes partly disagree: the daily frame holds above its 200-day average while the weekly sits well below its 50-week, even though both describe the same mixed short-term structure.
Over the trailing periods ADAUSD is down 7.73% on the week and 4.53% on the month, up 25.35% on the quarter, yet down 67.24% across the year — the quarter’s gain set against a far larger annual decline.
Descriptive technical summary generated by the ForexBullion Research Team from our own price feed. Not investment advice.




