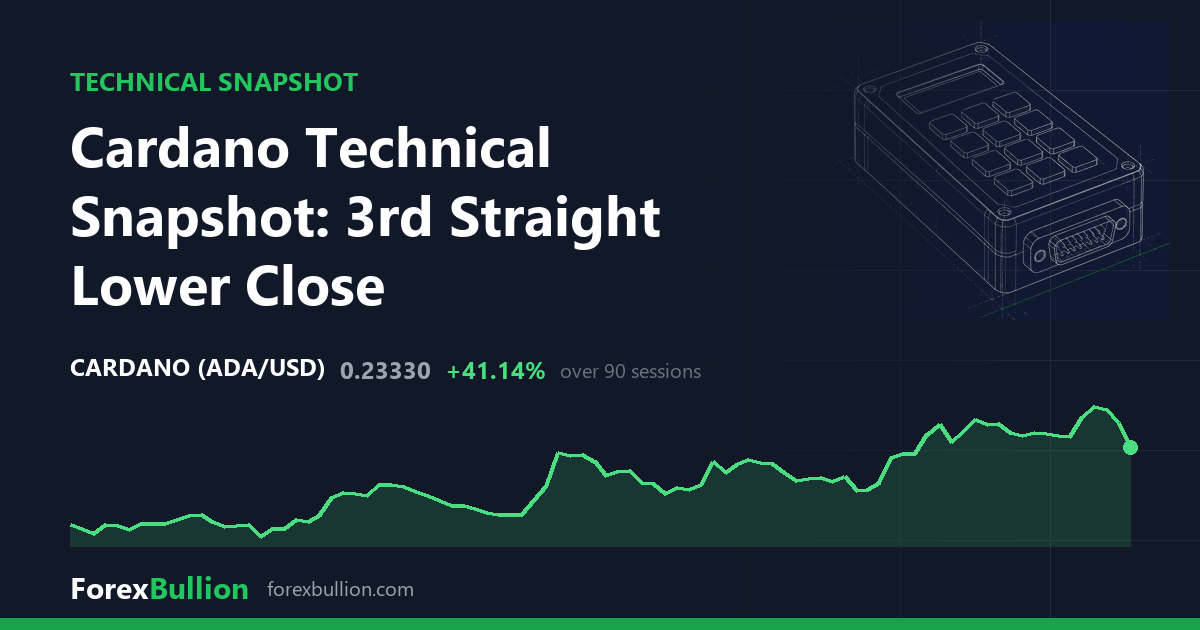
Cardano (ADAUSD) last traded at 0.2333, down 8.44% on the session.
Daily picture
By the daily moving averages the structure reads as an uptrend: price holds above the 50-day average, and the 50-day sits above the 200-day. At 0.2333 the last price is 3.73% above the 50-day SMA at 0.2249 and 9.69% above the 200-day SMA at 0.2127, but 5.89% below the 20-day SMA at 0.2479. The 20-day average itself still sits above both the 50-day (0.2249) and the 200-day (0.2127), so the averages remain in rising order even as price has slipped beneath the shortest of them. The last price of 0.2333 therefore sits between the 50-day average below it and the 20-day average above.
The 14-day RSI reads 46.9, a neutral value inside the 30-70 band and below the 50 midline. The 14-day ATR is 0.0176, equal to 7.54% of the current price, so the session’s 8.44% fall is wider than a typical daily range. Measured against the instrument’s own past year, that ATR falls at the 58th percentile — modestly above the median daily range of the last twelve months.
Price is 71.67% below the 52-week high of 0.8236 and 69.06% above the 52-week low of 0.138, placing it in the lower 14% of its 52-week range. The high was set 363 sessions ago, whereas the low is more recent at 105 sessions back. Over the last 20 sessions the swing high is 0.2819 and the swing low is 0.2178; extending to 60 sessions holds the same 0.2819 high but lowers the floor to 0.1708. At 0.2333 the last price sits nearer that 20-day swing low than its high, and has posted 3 consecutive lower closes.
Weekly picture
On the weekly bars the trend sits below the 50-week average with a mixed short-term structure. Price is 18.37% above the 20-week SMA at 0.1971 but 15.99% below the 50-week SMA at 0.2777, and the most recent week closed down 10.03%. The 20-week average also sits below the 50-week, the mirror of the daily arrangement. The weekly RSI is 48.3, likewise neutral. The two timeframes disagree: the daily chart has price above both its 50- and 200-day averages, while the weekly chart keeps price below its 50-week average.
Over the past month ADAUSD is up 10.41% and over the past quarter up 40.37%, while the past week is down 4.35% and the trailing year shows a decline of 71.4% from its level twelve months ago.
Descriptive technical summary generated by the ForexBullion Research Team from our own price feed. Not investment advice.




