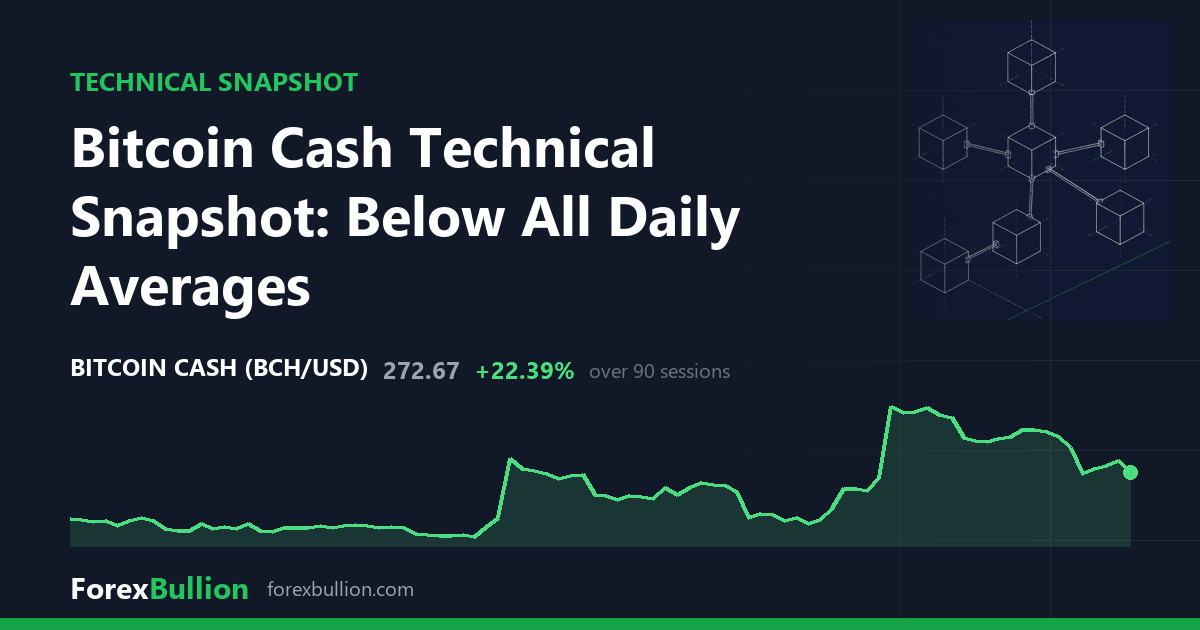
Bitcoin Cash (BCHUSD) last changed hands at 272.67, down 4.58% on the session.
The daily structure is a downtrend, with price below the 50-day average and the 50-day below the 200-day. The market sits 11.76% under its 20-day line (309.01) and 9.11% under its 200-day line (300.01), while trading just 0.39% below the 50-day (273.73) — close enough to be effectively resting on it. At 273.73 the 50-day is the nearest of the three averages to price, with the shorter 20-day and the longer 200-day both stacked above.
Momentum and volatility
Daily RSI(14) reads 42.8, a neutral value inside the 30-70 band. ATR(14) stands at 16.77, equal to 6.15% of price. Measured against Bitcoin Cash’s own past year, that ATR sits at the 38th percentile — below the midpoint, so the recent daily range is toward the quieter half of what the instrument has carried over the last twelve months.
Price is 59.2% below the 52-week high of 668.35 and 51.01% above the 52-week low of 180.56. Those extremes were set at different times: the high 280 sessions ago, the low the more recent of the two at 110 sessions back. Within that span the market registers at the 19th percentile of its 52-week range, placing it in the lower fifth. The 20-day swing runs from a low of 267.56 to a high of 365.4, leaving the last price just above the base of that recent band, while the 60-day swing stretches down to 199.18. The 20-day and 60-day swing highs are identical at 365.4, so the highest print of the past three months also falls within the last month.
The weekly view
On the weekly chart the trend reads as below the 50-week average but with a mixed short-term structure. Price is 12.92% above its 20-week average (241.48) yet 31.28% below its 50-week average (396.81), and weekly RSI(14) is 45.8 — also neutral. The two timeframes only partly agree: the daily trend is clearly lower, with price under all three daily averages, whereas on the weekly scale the market has recovered back above its shorter 20-week line even while staying well beneath the longer 50-week one. That divergence is a function of where the two 20-period averages fall — the daily one above the market, the weekly one below. The most recent weekly bar closed 4.58% lower.
Over longer windows the performance is split: Bitcoin Cash is up 23.64% on the month and 15.31% on the quarter, yet down 12.51% on the week and 50.09% across the full year.
Descriptive technical summary generated by the ForexBullion Research Team from our own price feed. Not investment advice.




