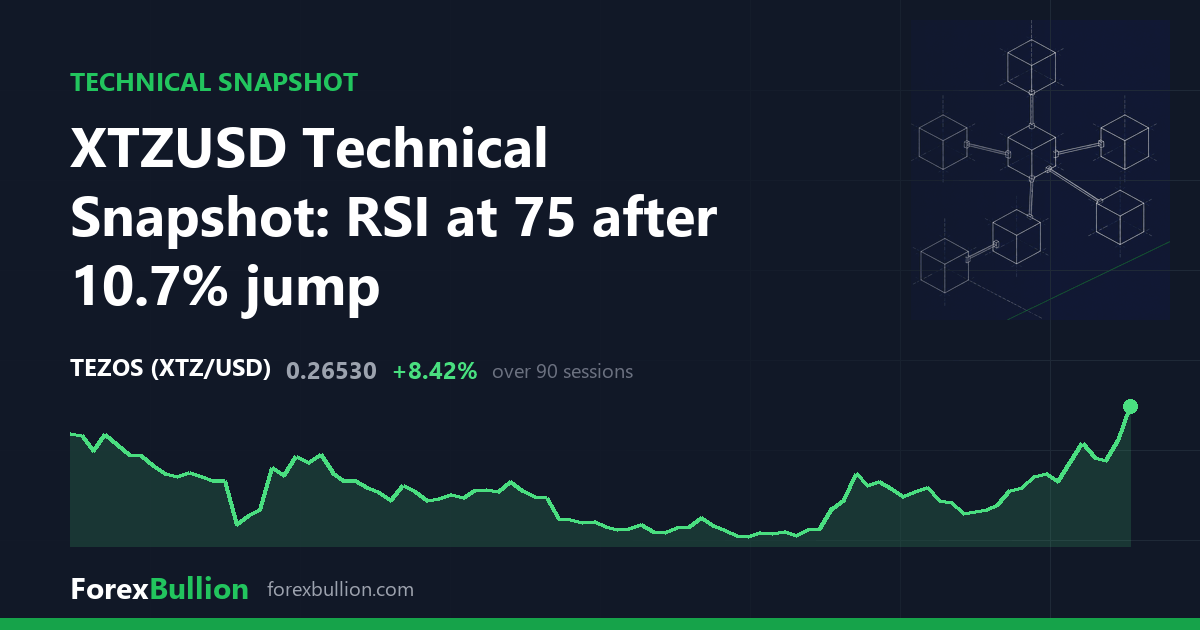
XTZUSD (Tezos CFD) last traded at 0.2653, up 10.68% on the session and extending a sharp near-term recovery.
Trend and moving averages
The daily structure is described as below the 200-day average but with a mixed short-term structure. Price sits 26.15% above its 20-day average (0.2103) and 37.75% above its 50-day average (0.1926), a wide gap that reflects how far the recent run has stretched from those shorter means. Against the 200-day average at 0.2826, price remains 6.12% lower, leaving the longer trend reference still overhead.
Momentum and volatility
The 14-day RSI reads 75.2, an elevated level often described as overbought. The 14-day ATR is 0.0168, or 6.33% of price — a substantial daily range in percentage terms, though at the 36th percentile of the past year it sits below the middle of this instrument’s own recent volatility band.
Price sits 68.06% below its 52-week high of 0.8307 and 60.5% above its 52-week low of 0.1653. The range_position_pct of 15 places it in the lower portion of that annual band despite the recent rally. The 52-week high was set 359 sessions ago, while the low was made just 32 sessions back, so the extreme low is far more recent. The 20-day swing runs from 0.1816 to 0.2784, and the 60-day swing spans 0.1653 to the same 0.2784 high. Price is currently below that 0.2784 swing high, the nearest prior peak on both the 20- and 60-day windows. The tape shows 2 consecutive higher closes.
Weekly picture
The weekly structure is described as below the 50-week average but with a mixed short-term structure — broadly consistent with the daily read on the long-term side. Price stands 8.15% above the 20-week average (0.2453) but 31.0% below the 50-week average (0.3845), so the two timeframes agree that the higher, longer average remains overhead. The weekly RSI is 46.7, a mid-range reading that contrasts with the elevated 75.2 on the daily — the shorter timeframe is running hotter than the weekly. The last week closed up 23.51%.
Over longer windows, XTZUSD is up 26.82% on the week and 54.15% on the month, ahead 10.01% on the quarter, but down 65.47% over the past year.
Descriptive technical summary generated by the ForexBullion Research Team from our own price feed. Not investment advice.




