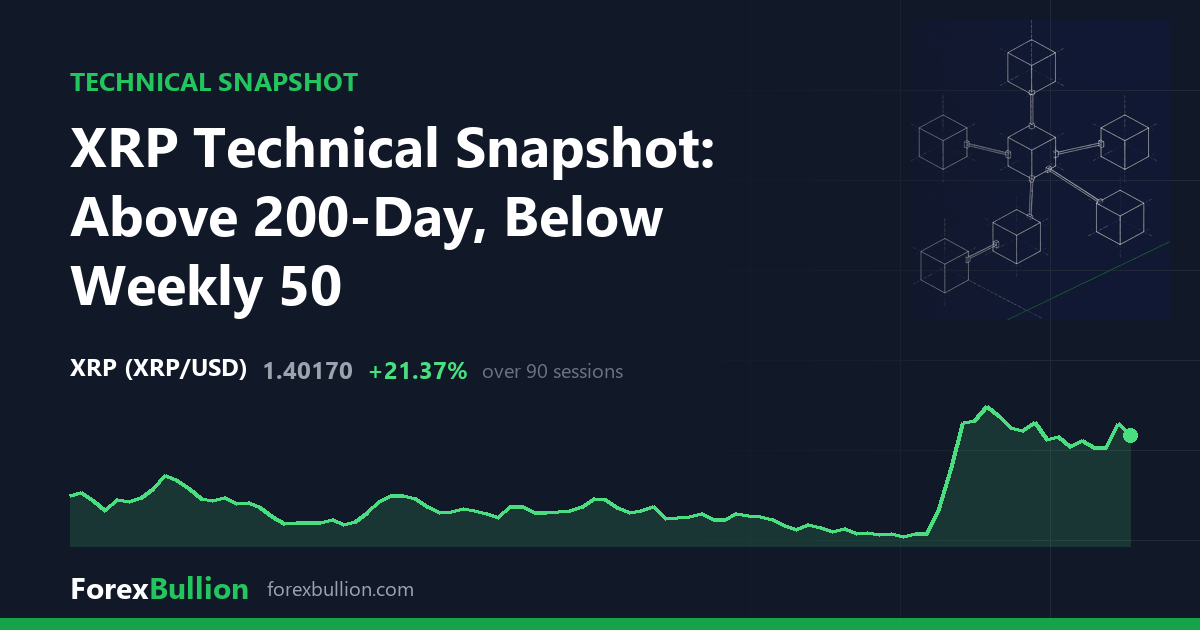
XRP (XRPUSD) last traded at 1.4017, down 3.34% on the session.
Trend
The daily structure is described as above the 200-day average but with a mixed short-term structure. Price sits 5.17% above its 20-day SMA (1.3328), 19.63% above its 50-day SMA (1.1717) and 10.04% above its 200-day SMA (1.2738). All three averages are below the current price, with the 50-day the furthest away in percentage terms.
Momentum and volatility
The 14-day RSI reads 60.6, placing it in neutral territory within the 30-70 band. ATR over 14 days is 0.0827, equal to 5.9% of the last price. That volatility reading sits at the 48th percentile of the past year, roughly mid-range against XRP’s own recent history rather than at an extreme.
Over longer windows, the instrument is up 35.63% on the month and 28.28% on the quarter, while the week is close to flat at 0.44%. The trailing year shows a decline of 50.2%.
Range position
Price is 56.02% below the 52-week high of 3.1868 and 42.15% above the 52-week low of 0.9861. The range_position_pct of 19 places the current price in the lower fifth of its 52-week span. The 52-week high was set 356 sessions ago, while the 52-week low was made just 21 sessions ago, so the recent extreme is the downside one.
Within nearer windows, the 20-day swing high is 1.699 and the 20-day swing low is 0.9869; the 60-day swing high is also 1.699 and the 60-day swing low is 0.9861. The last price sits between those bounds, below the 1.699 swing high shared by both windows.
Weekly picture
The weekly frame is described as below the 50-week average but with a mixed short-term structure. Price is 13.44% above the 20-week SMA (1.2356) but 14.53% below the 50-week SMA (1.6399). The weekly RSI reads 51.8, near the midpoint of its band, and the last week closed up 3.32%. The two timeframes disagree on one point: the daily read has price above all three of its averages, while the weekly read has price still under its 50-week line.
Over the trailing year XRP shows a 50.2% decline, with the last price sitting 56.02% under the 52-week high.
Descriptive technical summary generated by the ForexBullion Research Team from our own price feed. Not investment advice.