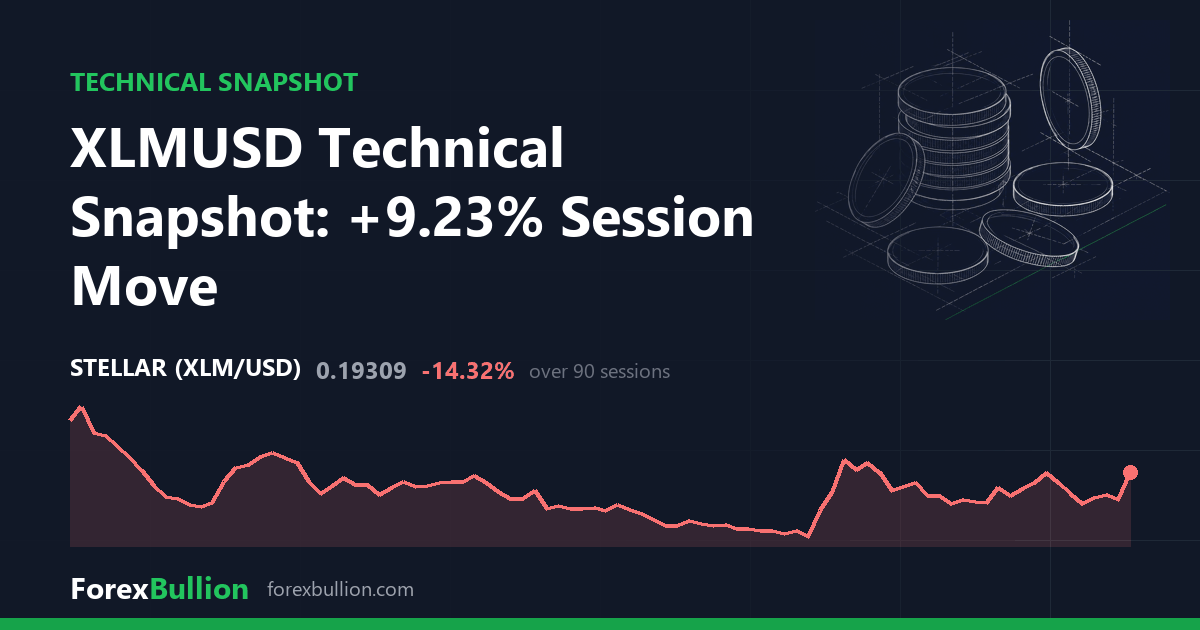
Stellar (XLMUSD) last traded at 0.19309, up 9.23% on the session.
Trend and moving averages
The daily structure reads as above the 200-day average but with a mixed short-term structure. Price sits 6.39% above its 20-day SMA (0.1815), 10.53% above its 50-day SMA (0.1747) and 10.09% above its 200-day SMA (0.1754). The three averages are clustered closely together — the 50-day and 200-day are within a fraction of each other — while price extends above all of them, a configuration where the shorter-term recovery has pulled the instrument clear of its longer-term baselines.
Momentum and volatility
The 14-day RSI reads 59.0, which sits in neutral territory (30-70). ATR over 14 days is 0.0098, equivalent to 5.08% of price. That absolute volatility ranks in the 32nd percentile against the past year, meaning the daily range is running toward the calmer end of the instrument’s own twelve-month history despite the sharp session move.
Placing price within its range, XLMUSD sits 53.39% below its 52-week high of 0.41423 and 42.04% above its 52-week low of 0.13594. The range-position reading of 21 puts it in the lower fifth of that band. The 52-week high was set 347 sessions ago and the 52-week low 220 sessions ago, so neither extreme is recent. Nearer in, the 20-day swing high is 0.1965 and the 20-day swing low 0.171; over 60 days the swing high is 0.22217 and the swing low 0.15203. Current price sits just under its 20-day swing high and toward the upper part of the 60-day band.
Weekly picture
The weekly frame reads as below the 50-week average but with a mixed short-term structure. Price is 4.77% above the 20-week SMA (0.1843) but 3.98% below the 50-week SMA (0.2011), and the weekly RSI stands at 50.3 — squarely mid-range. This is where the timeframes diverge: the daily read has price above its 200-day line, while the weekly read still has it beneath its 50-week average. The daily recovery has not yet lifted price back above the slower weekly benchmark. Last week closed 9.23% higher, matching the session gain.
Across the performance windows, XLMUSD is up 3.01% on the week and 23.82% on the month, but down 10.79% on the quarter and 49.25% over the year.
Descriptive technical summary generated by the ForexBullion Research Team from our own price feed. Not investment advice.




