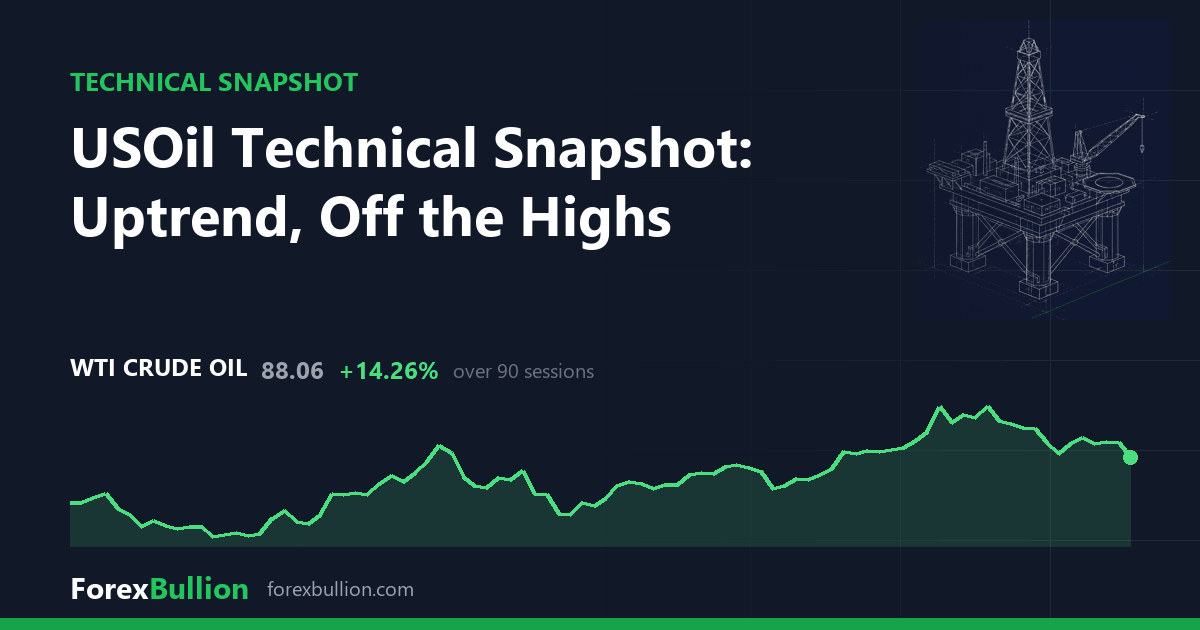
USOil is trading at 88.06, down 4.03% on the session and marking a second consecutive lower close; the day’s fall is larger than the 3.79% recorded over the past week, so most of the move is concentrated in the latest session.
Trend, momentum and volatility
The daily structure reads as an uptrend: price holds above the 50-day average, and the 50-day sits above the 200-day. At 88.06 the market is 0.66% above its 50-day at 87.48 and 0.91% above its 200-day at 87.26, leaving those two averages clustered closely together just beneath spot. The relationship inverts against the shorter 20-day at 94.25, where price trades 6.57% below the line. That 20-day mean itself sits well above the 50- and 200-day, so the recent decline has unwound the higher prices of the past few weeks and pulled spot back toward the longer averages. In fact the 20-day is the only one of the three averages price now trades below.
RSI(14) reads 42.9, a neutral value inside the 30-70 band and below its midpoint, consistent with the two lower closes and the session’s 4.03% drop. ATR(14) stands at 3.65, equal to 4.14% of price. At the 63rd percentile of the past year, that daily range sits above its typical level over the last twelve months without reaching an extreme.
Range and weekly picture
Price is 26.3% below the 52-week high of 119.49 and 60.15% above the 52-week low of 54.99, placing it at the 51st percentile of that range — near the middle. The high was set 174 sessions ago and the low 245 sessions ago, so both extremes are well in the past. Over the last 20 sessions the swing high is 102.08 and the swing low 87.87, the latter just beneath current price; the 60-day range shares that 102.08 high but extends down to 73.53, so the peak of the past 20 sessions also marks the 60-day high, while the 20-day swing low sits well above the 60-day one.
On the weekly chart the trend also reads as an uptrend, with price above the 20-week average at 84.77 and the 20-week above the 50-week at 79.58. Price is 3.88% above the 20-week and 10.66% above the 50-week, and weekly RSI(14) is 51.8, just over its midpoint. The two timeframes agree on direction, though the daily RSI at 42.9 sits below the weekly at 51.8, reflecting the recent softness — the latest week closed down 4.22%.
Over the past month USOil is up 2.98%, over the quarter up 27.79%, and across the year up 41.17%.
Descriptive technical summary generated by the ForexBullion Research Team from our own price feed. Not investment advice.