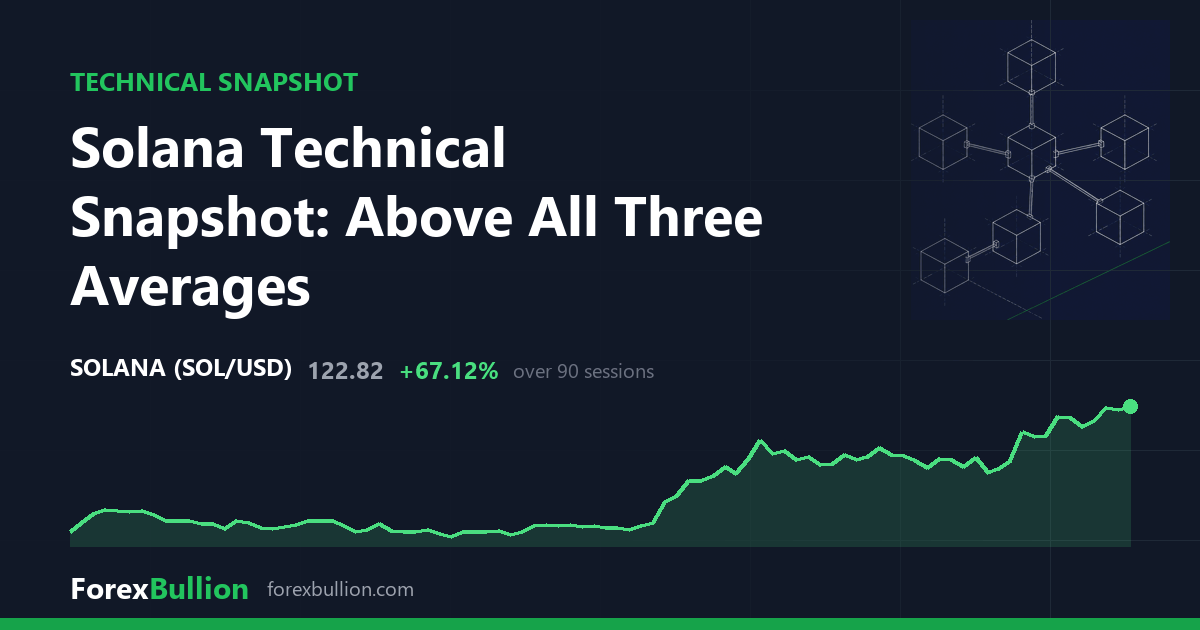
Solana (SOLUSD) last traded at 122.82, up 1.24% on the session.
Trend and moving averages
The daily structure reads as an uptrend, with price above the 50-day average and the 50-day above the 200-day. SOLUSD sits 12.9% above its 20-day average of 108.79, 24.58% above the 50-day of 98.58 and 44.61% above the 200-day of 84.93. The three averages line up in ascending order beneath the current price — computed across 401 daily bars — with the widest gap to the 200-day, the slowest of the set.
Momentum registers an RSI of 69.4, which the data classes as neutral within the 30-70 band, though the reading sits at the top of that band, just under the 70 mark. The 14-day ATR is 5.22, equal to 4.25% of price. At the 51st percentile over the past year, that daily range sits close to the midpoint of what Solana has posted across the last twelve months — neither a compressed nor an unusually wide phase by its own recent standard.
Range and weekly picture
Price is 48.36% below the 52-week high of 237.82 and 104.42% above the 52-week low of 60.08, which places it at 35 in its 52-week range, the lower-middle of the yearly span. The 20-day swing runs from 95.68 to 124.85, and price trades just under that 124.85 high, which is also the 60-day swing high. The 60-day low of 70.49 lies well beneath the 20-day low of 95.68, so the two-month base sits far lower than the one-month base, and that 20-day low of 95.68 sits close to the 50-day average of 98.58. The 52-week high was set 356 sessions ago, while the 52-week low is more recent at 113 sessions back.
On the weekly chart, price is above the 50-week average but with a mixed short-term structure: it stands 44.0% above the 20-week average of 85.29 and 18.44% above the 50-week of 103.70, with the 20-week average itself sitting below the 50-week. Last week closed up 10.57%, and the weekly RSI is 65.1 — elevated like the daily 69.4, but neither timeframe has crossed the 70 line. Built on 58 weekly bars, the weekly broadly agrees with the daily uptrend in that price leads its longer averages, though its short-term average order is less clean than the daily arrangement.
Over the longer run, Solana is up 3.38% on the week, 16.35% on the month and 63.67% on the quarter, yet remains down 41.74% over the past year.
Descriptive technical summary generated by the ForexBullion Research Team from our own price feed. Not investment advice.




