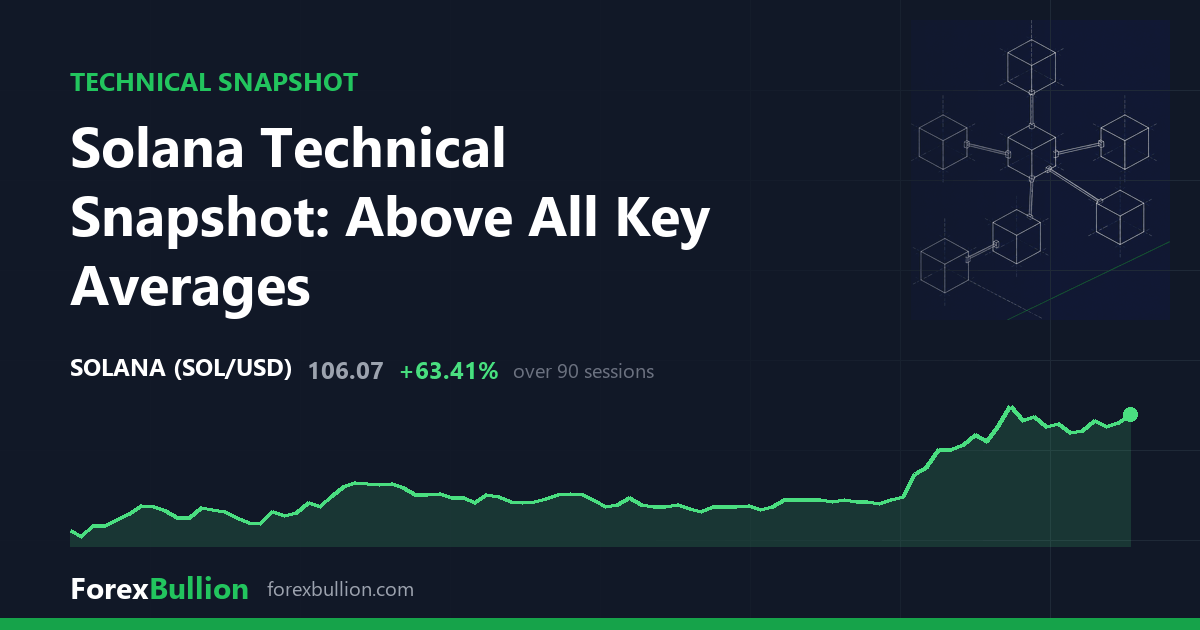
Solana (SOLUSD) last traded at 106.07, up 2.87% on the session and posting a second consecutive higher close.
Trend and moving averages
The daily structure reads as an uptrend, with price above the 50-day average and the 50-day above the 200-day. Price sits 7.76% over its 20-day SMA (98.43), 25.78% over its 50-day SMA (84.33), and 28.71% over its 200-day SMA (82.41). All three averages stack below spot, and the widening gap to the longer-dated lines reflects how far the recent advance has stretched from its base.
Momentum and volatility
RSI(14) reads 67.7, described as neutral within the 30-70 band though pressed toward its upper edge. The 14-day ATR is 4.86, or 4.59% of price. Against Solana’s own past year, that volatility sits at the 41st percentile — roughly mid-range, neither the calmest nor the most active stretch of the last twelve months.
Position in the range
Spot sits 58.18% below the 52-week high of 253.61 and 76.54% above the 52-week low of 60.08. That places it at the 24th percentile of its one-year range. The high was set 353 sessions ago, nearly a year back, while the low is more recent at 92 sessions ago. Over the last 20 days price has ranged between a swing high of 110.54 and a swing low of 75.10; the 60-day swing shares the same 110.54 top with a lower floor at 70.49, so the current price sits just under both windows’ highs.
The performance record frames the move: SOLUSD is up 3.02% on the week, 39.75% over the month and 58.81% over the quarter, yet still down 48.6% across the year.
Weekly picture
The weekly frame is more mixed. Price trades below its 50-week average — 3.36% under the 109.76 line — while standing 29.38% above the 20-week SMA at 81.98, a structure the data labels below the 50-week average but with a mixed short-term profile. Weekly RSI(14) is 60.7, and last week closed up 4.31%. The two timeframes diverge here: the daily read is a clean uptrend above all its averages, whereas the weekly still has price beneath its longer 50-week line, so the recovery visible on the daily chart has not yet lifted spot back above that higher-timeframe average.
On a one-year view Solana remains down 48.6%, even after a quarter that added 58.81%.
Descriptive technical summary generated by the ForexBullion Research Team from our own price feed. Not investment advice.