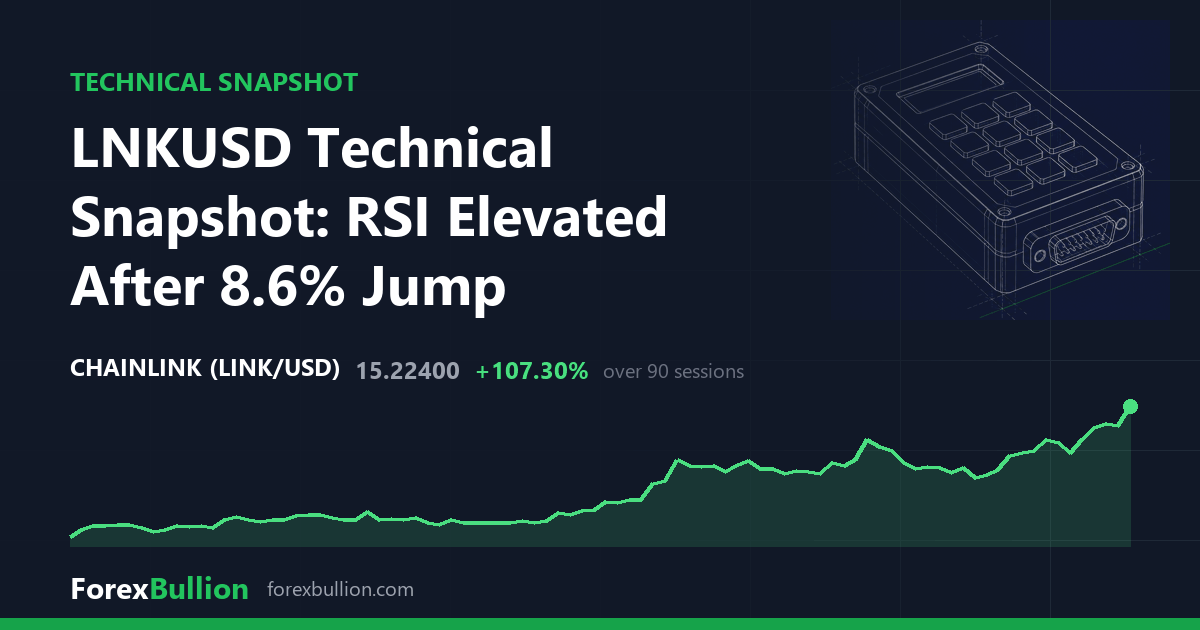
LNKUSD last traded at 15.224, up 8.62% on the session.
Trend
Across the 401 daily bars in the sample the structure is an uptrend, with price above the 50-day average and the 50-day above the 200-day. At 15.224 the market sits 22.54% above its 20-day average of 12.4234, 32.53% above the 50-day of 11.4874 and 61.85% above the 200-day of 9.4061, so the three averages line up in ascending order beneath price and the gap widens across each longer lookback.
Momentum and volatility
RSI(14) reads 73.2, an elevated level often described as overbought. ATR(14) is 0.8333, equal to 5.47% of price, and that absolute figure sits at the 76th percentile of the past twelve months — daily ranges have run wider than roughly three-quarters of the sessions over the year, in the upper quarter of the instrument’s own history rather than at an extreme.
Against its 52-week range, price sits 35.82% below the high of 23.721 and 117.89% above the low of 6.987, which places it at the 49th percentile of that band, close to the midpoint. The high was set 356 sessions ago, whereas the low is far more recent at 114 sessions back. Over the past 20 days the market has held between a swing low of 10.599 and a swing high of 15.467, and that 15.467 print is also the 60-day swing high, so the highest point of the last three months formed within the last month. The 60-day swing low is 7.877, above the 52-week low of 6.987, consistent with the annual trough having formed before the 60-day window. At 15.224, price sits just beneath that recent swing high.
On the weekly chart, built from 59 bars, price is above the 50-week average but with a mixed short-term structure: it trades 54.08% above the 20-week average of 9.8809 and 41.8% above the 50-week of 10.7365, yet the 20-week average itself sits below the 50-week, which accounts for the mixed near-term read. The weekly RSI(14) is 66.3 — firm, but below the elevated daily reading — and the latest week closed up 8.62%, the same figure as the session move. The two timeframes agree that price holds above its longer averages, though weekly momentum is less stretched than on the daily.
Performance shows a 16.75% gain over the past week and 36.7% over the past month, extending to 111.97% across the quarter, while the trailing twelve months remain down 29.94%, so the strong quarter has yet to erase the full-year loss.
Descriptive technical summary generated by the ForexBullion Research Team from our own price feed. Not investment advice.




