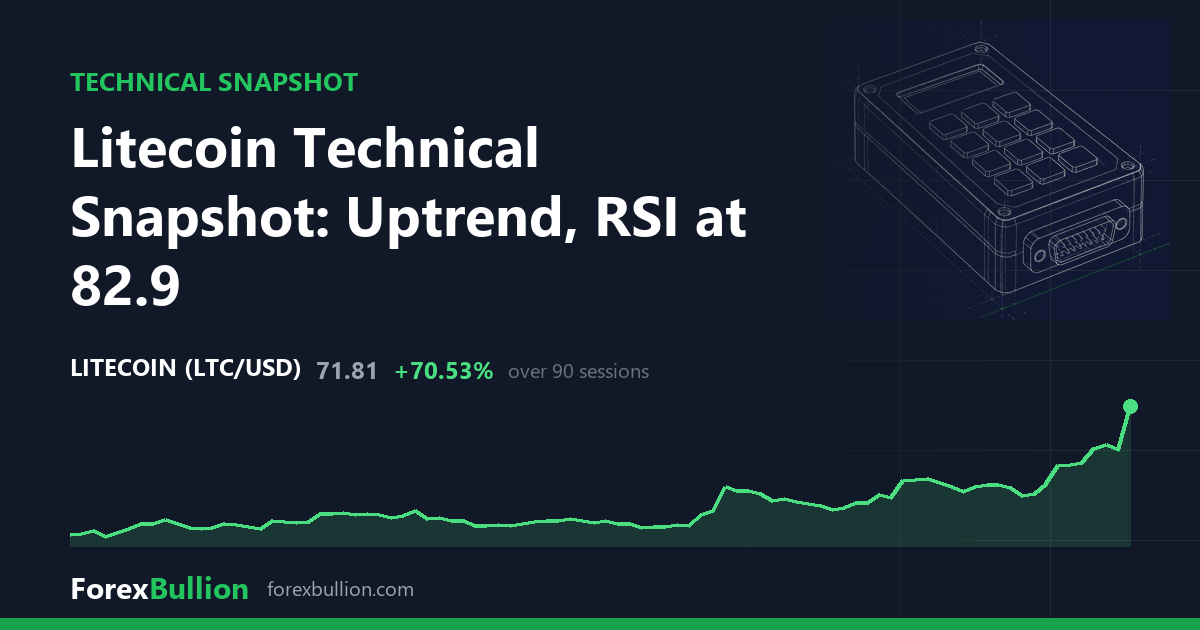
Litecoin (LTCUSD) last traded at 71.81, up 16.24% on the session, a reading drawn from 401 daily bars.
Trend and moving averages
The daily structure is an uptrend, with price above the 50-day average and the 50-day above the 200-day. At 71.81, price sits 27.31% above its 20-day mean of 56.41, 40.21% above the 50-day of 51.22 and 41.92% above the 200-day of 50.60. Those three averages are clustered within about six points of one another, from 50.60 to 56.41, so the latest move has carried price well clear of a tightly grouped set of longer-term means.
Momentum, volatility and range
The 14-day RSI reads 82.9, in the elevated zone commonly described as overbought (at or above 70). The 14-day ATR is 3.6673, equal to 5.11% of price; measured against Litecoin’s own trailing year, that volatility sits at the 68th percentile — higher than roughly two-thirds of the past year’s readings. The single-session gain of 16.24% is roughly three times that average daily range.
Price is 47.17% below the 52-week high of 135.92 and 88.28% above the 52-week low of 38.14 — about 64.11 beneath the high and 33.67 above the low in price terms — leaving it at 34% of the 52-week range, still within the lower third of where it has traded over the past year. The data marks both extremes as last touched 349 sessions ago. The 20-day swing spans 50.13 to 75.01 and the 60-day range runs from 43.28 to that same 75.01 high; the 20-day floor at 50.13 sits above the 60-day low of 43.28, so the base of the recent range has risen, and at 71.81 price rests about 3.20 beneath the 75.01 swing high that caps both windows.
On the weekly timeframe, built from 58 weekly bars, price is above the 50-week average but with a mixed short-term structure: it stands 44.81% above the 20-week mean of 49.59, yet that 20-week average is itself below the 50-week of 61.91, which price holds 16.0% above. Last week added 22.38%, and the weekly RSI is 65.3 — firm but short of the elevated threshold the daily RSI has already cleared. The two timeframes agree on direction but differ in degree: the daily RSI is stretched at 82.9 while the weekly at 65.3 is not.
Over the trailing windows Litecoin is up 23.6% on the week, 42.31% on the month and 71.59% on the quarter, yet it remains down 29.82% across the past year — the quarter’s advance has not offset the twelve-month decline.
Descriptive technical summary generated by the ForexBullion Research Team from our own price feed. Not investment advice.




