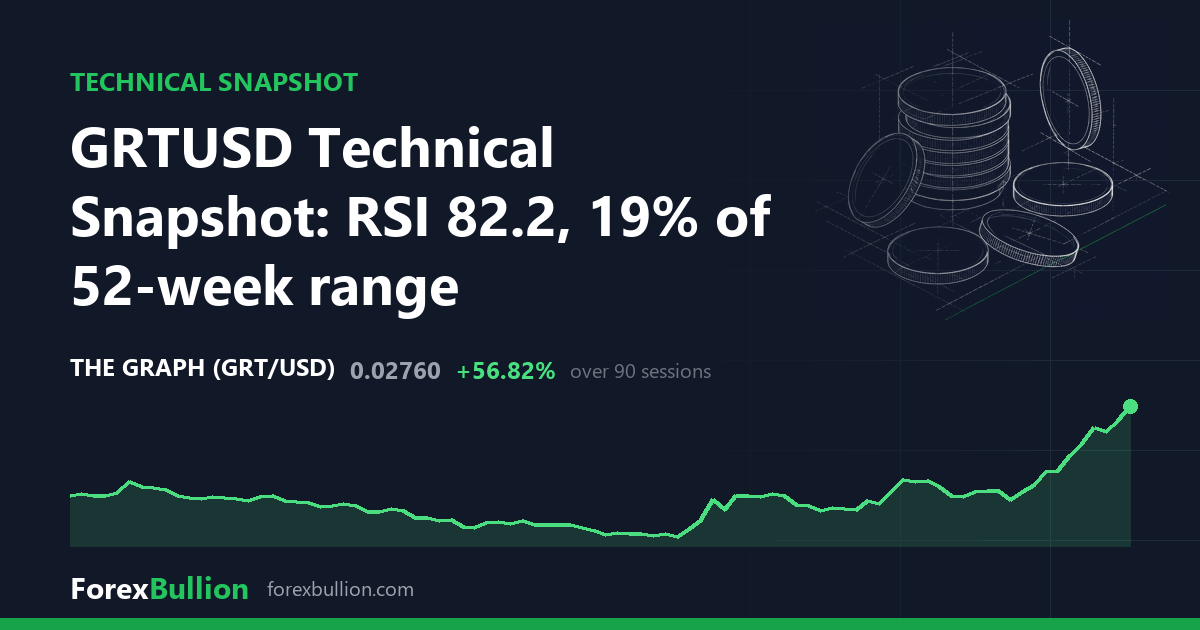
GRTUSD last traded at 0.0276, up 6.15% on the session and logging a second consecutive higher close.
The daily picture
The daily read is above the 200-day average but with a mixed short-term structure. Spot sits 32.06% above the 200-day line at 0.0209, 35.29% above the 20-day at 0.0204, and 58.62% above the 50-day at 0.0174, so price trades clear of all three references. The stack itself is not cleanly ordered: the 50-day at 0.0174 is the lowest of the three, printing beneath both the 20-day at 0.0204 and the 200-day at 0.0209, which is the mixed short-term structure the trend label points to.
The 14-day RSI reads 82.2, an elevated level that sits at or above 70 and is often described as overbought. The 14-day ATR is 0.0017, or 6.16% of the 0.0276 price. Measured against GRTUSD’s own past year, that ATR sits at the 48th percentile, near the midpoint of the volatility the instrument has recorded over the last twelve months rather than at an extreme.
Price is 68.99% below the 52-week high of 0.089 and 115.62% above the 52-week low of 0.0128, placing it at the 19th percentile of its 52-week range — the lower fifth of that band. The timing of the two extremes differs sharply: the 52-week high was set 357 sessions ago, whereas the low is far more recent at 37 sessions back. Closer in, the 20-day swing runs from a low of 0.0167 to a high of 0.0287, while the 60-day swing spans 0.0128 to 0.0287 — its low of 0.0128 the same level as the 52-week low, placing that annual trough inside the 60-day window. The last price of 0.0276 therefore sits near the upper edge of both recent bands, just beneath the 0.0287 high they share. Shorter-horizon performance is firm, up 35.29% on the week, 57.71% on the month, and 56.82% on the quarter.
The weekly picture
The weekly frame reads below the 50-week average but with a mixed short-term structure. Price is 43.75% above the 20-week average of 0.0192 yet 8.0% below the 50-week average of 0.03, and the most recent week closed up 25.45%. The weekly RSI is 56.7, only modestly above the 50 midline and a far more moderate reading than the elevated 82.2 on the daily. The two timeframes disagree on the longer trend: the daily has reclaimed its 200-day average while the weekly still trades under its 50-week average.
Across the trailing year GRTUSD is down 66.46%, its weakest reading on any of the horizons measured here.
Descriptive technical summary generated by the ForexBullion Research Team from our own price feed. Not investment advice.




