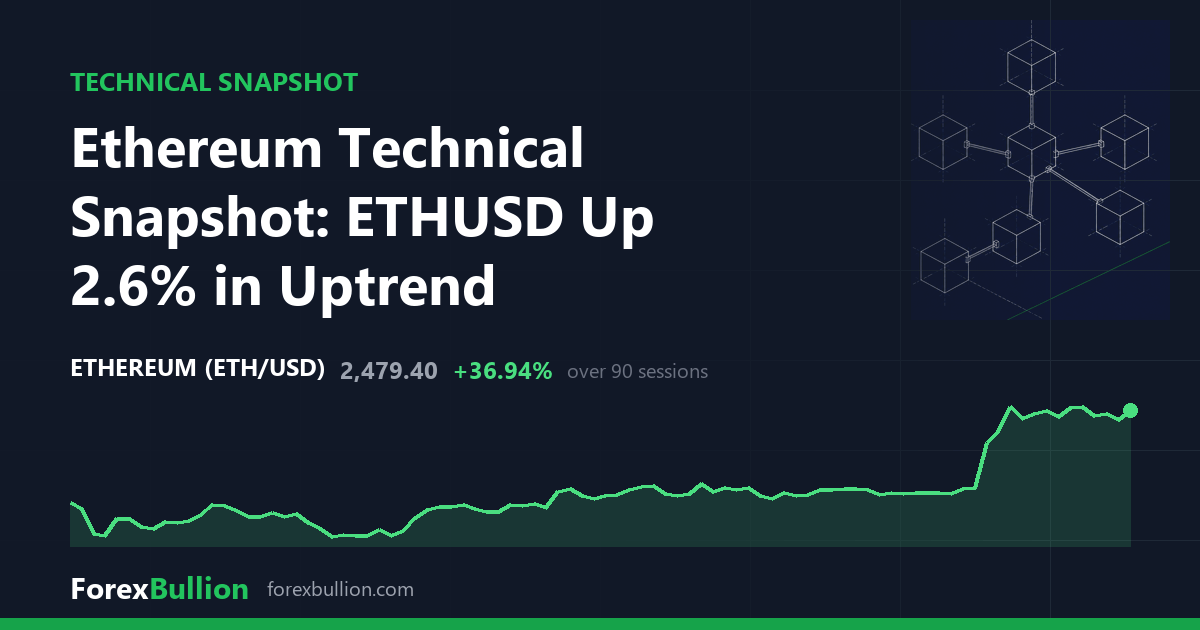
Ethereum (ETHUSD) trades at 2479.4, up 2.6% on the session.
Trend and moving averages
The daily structure reads as an uptrend, with price above the 50-day and the 50-day above the 200-day. Price sits 10.35% above its 20-day average (2246.91), 22.11% above the 50-day (2030.40), and 22.43% above the 200-day (2025.23). The 50-day and 200-day averages are close together, at 2030.40 and 2025.23 respectively, while price holds well clear of both.
Momentum, volatility and range
The 14-day RSI reads 69.5, described as neutral within the 30-70 band though sitting near its upper edge. The 14-day ATR is 95.80, or 3.86% of price. That volatility sits at the 34th percentile of the past year, meaning readings have been higher across most of the last twelve months.
Within its 52-week range, ETHUSD sits 48.01% below the high of 4769.33 and 64.74% above the low of 1505.08, placing it around the 30th percentile of that range. The 52-week high was set 352 sessions ago, while the low is more recent at 86 sessions back. Over the last 20 days, price has ranged between a swing high of 2566.14 and a swing low of 1861.53; the 60-day swing high matches at 2566.14, while the 60-day swing low sits lower at 1692.69. Current price is beneath the 20-day swing high of 2566.14.
Performance figures show a 1.52% gain over the week, 31.7% over the month, and 33.49% over the quarter, against a 12-month change of -42.55%.
Weekly picture
The weekly frame describes a market below its 50-week average but with a mixed short-term structure. Price sits 22.68% above the 20-week average (2020.99) yet 2.48% below the 50-week average (2542.42). The weekly RSI reads 58.9, and last week closed 2.6% higher. This is a partial disagreement with the daily read: the daily timeframe shows price firmly above all three of its averages, while the weekly still holds below its 50-week line, so the longer-horizon average has not yet been reclaimed even as the shorter-term daily picture points up.
The 12-month change of -42.55% against a 33.49% quarterly gain frames a recovery within a still-negative year.
Descriptive technical summary generated by the ForexBullion Research Team from our own price feed. Not investment advice.