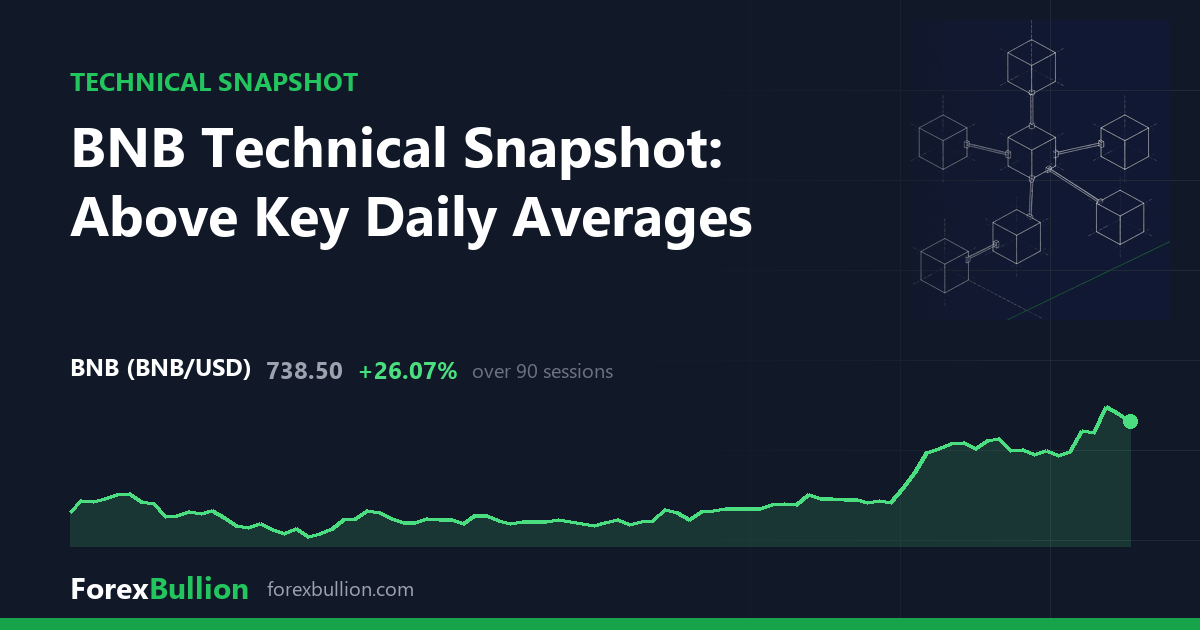
BNB (BNBUSD) last traded at 738.50, down 1.79% on the session.
Trend and moving averages
The daily structure reads as an uptrend, with price above the 50-day average and the 50-day sitting above the 200-day. BNB is 5.5% above its 20-day SMA (700.00), 16.71% above its 50-day SMA (632.79) and 18.85% above its 200-day SMA (621.38), so price sits clear of all three references. The stacked ordering of the averages describes a market trading above its medium- and longer-term means.
Momentum on the daily RSI(14) reads 66.9, a neutral figure within the 30-70 band and toward its upper end. ATR(14) stands at 23.91, or 3.24% of price. That volatility sits at the 43rd percentile of the past year, roughly mid-range against BNB’s own recent history rather than an extreme. The tape currently shows 2 consecutive lower closes.
Range and levels
Within its 52-week span, BNB is 46.34% below the high of 1376.24 and 37.83% above the low of 535.81, placing it at the 24th percentile of that range. The 52-week high was set 329 sessions ago, while the low is more recent at 68 sessions back. The 20-day swing high is 779.89 with a 20-day swing low of 600.13; the 60-day swing high matches at 779.89 and the 60-day swing low is 554.24. Price therefore sits below its nearest 20- and 60-day peaks and above the recent troughs.
On performance, BNB is up 8.31% over the past week, 22.88% over the month and 24.57% over the quarter, while remaining down 15.84% over the past year.
Weekly picture
The weekly frame is more mixed: it reads as below the 50-week average but with a mixed short-term structure. Price is 17.04% above the 20-week SMA (630.96) yet 1.14% below the 50-week SMA (747.01), so the two longer weekly means bracket the current price. The weekly RSI(14) is 59.9, and last week closed down 1.79%. That divergence matters — the daily read has price above all its key averages, while the weekly still holds beneath its 50-week line, so the two timeframes do not fully agree.
Over the trailing year BNB shows a decline of 15.84%, even as shorter windows post gains.
Descriptive technical summary generated by the ForexBullion Research Team from our own price feed. Not investment advice.