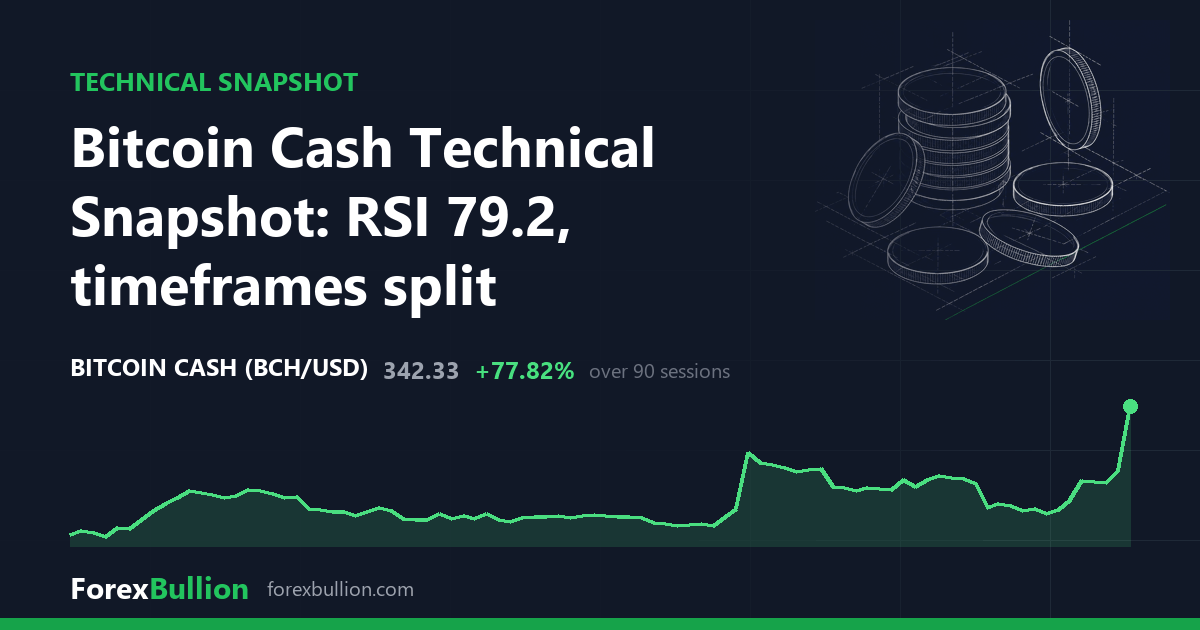
Bitcoin Cash (BCHUSD) last traded at 342.33, up 28.14% on the session.
Trend and momentum
The daily structure is above the 200-day average but with a mixed short-term structure. Price sits above all three daily moving averages: 8.57% above the 200-day (315.30) and much further above the shorter lines — 38.19% over the 20-day (247.72) and 43.51% over the 50-day (238.54). The 20-day and 50-day averages are close together (247.72 versus 238.54) and both sit well beneath the 200-day, so the longest of the three lines is also the highest. The recent advance has therefore carried price far above two shorter averages that remain clustered below the longer trend line.
Momentum is elevated: the 14-day RSI reads 79.2, a level at or above 70 that is often described as overbought. The 14-day ATR is 20.69, or 6.04% of price. That ATR sits at the 50th percentile of the past year — around the middle of Bitcoin Cash’s own volatility range over that window, neither unusually calm nor unusually stretched.
Range and the weekly view
Within its 52-week range, price is 48.78% below the 668.35 high and 89.59% above the 180.56 low, which places it about 33% of the way up that range. The high was set 260 sessions ago, while the low is more recent at 90 sessions back. Over the last 20 sessions price has moved between a swing low of 212.36 and a swing high of 346.62; the 60-day swing high is the same 346.62, with a lower 60-day swing low of 199.18, so the current level sits just under the top of both windows. That leaves price near the ceiling of its recent 20- and 60-day ranges but only about a third of the way up the wider 52-week range, and the last two sessions have each posted higher closes.
The weekly picture is more subdued and does not fully agree with the daily one. The weekly trend is below the 50-week average but with a mixed short-term structure: price is 36.55% above the 20-week average (250.70) yet 16.67% below the 50-week average (410.82). The weekly RSI is 54.2, mid-range and well below the daily 79.2. So while the daily frame has price above its 200-day line, the weekly frame still has it beneath its 50-week line — the two longer-term readings point in different directions, even as last week closed up 35.49%.
Over the past year Bitcoin Cash is down 38.44%. That sits against a 55.01% gain on the week, a 26.46% rise on the month and an 80.26% advance on the quarter — a run of shorter-term strength inside a year that is still negative overall.
Descriptive technical summary generated by the ForexBullion Research Team from our own price feed. Not investment advice.




