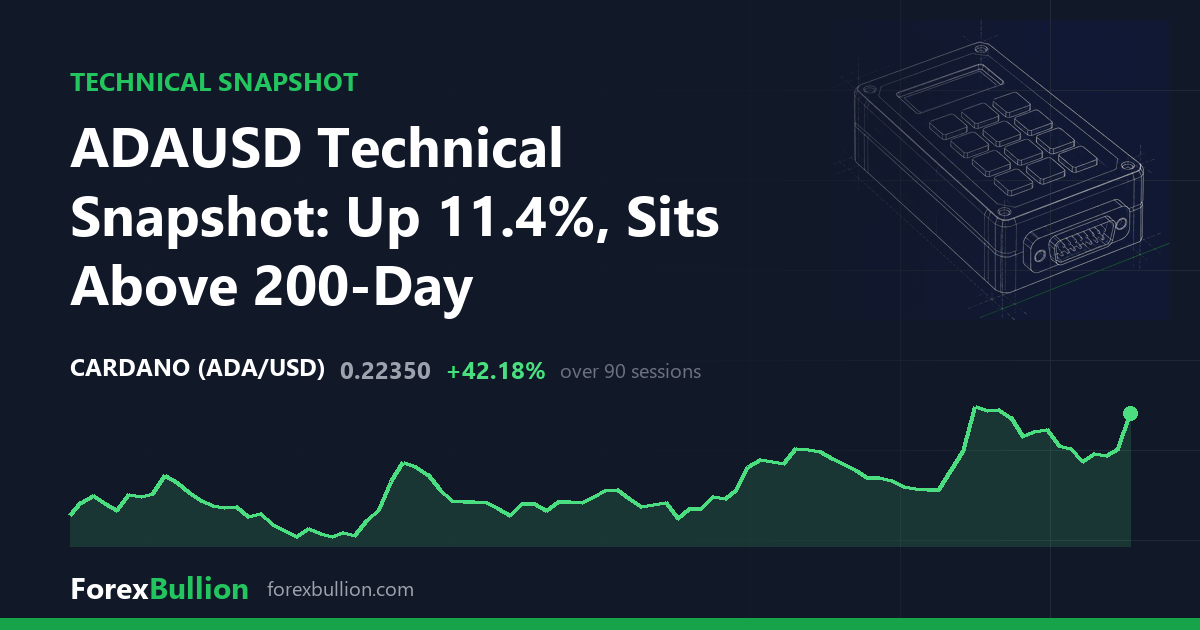
Cardano (ADAUSD) last traded at 0.2235, up 11.42% on the session.
Trend
The daily read is described as above the 200-day average but with a mixed short-term structure. Price sits 1.82% above the 200-day SMA at 0.2195, and further above the shorter averages: 10.86% over the 20-day SMA at 0.2016 and 19.71% over the 50-day SMA at 0.1867. The stack of shorter averages below current price reflects the recent push higher, while the near-flat gap to the 200-day marks the longer line as the pivot point.
Momentum and volatility
RSI(14) reads 64.2, placing it in the neutral 30-70 band and toward its upper half. ATR(14) stands at 0.014, or 6.26% of price — a wide daily range in absolute terms typical of the asset. That ATR sits at the 38th percentile of the past year, so current volatility is below the middle of its own 12-month distribution despite the sharp session gain. Cardano has logged 2 consecutive higher closes.
Range
Price sits 76.56% below the 52-week high of 0.9537 and 61.96% above the 52-week low of 0.138, putting it at just the 10th percentile of its 52-week range. The high was set 355 sessions ago, while the low is more recent at 70 sessions back. The 20-day swing runs from a low of 0.1708 to a high of 0.2581, and the 60-day band widens the floor to 0.1532 while sharing the same 0.2581 ceiling — placing the last price between those swing extremes.
Weekly picture
The weekly frame is described as below the 50-week average but with a mixed short-term structure, a partial disagreement with the daily read. Price sits 10.59% above the 20-week SMA at 0.2021 but 31.80% below the 50-week SMA at 0.3277, so the longer weekly average remains well overhead even as the shorter one is cleared. Weekly RSI(14) is 48.1, a middling reading near the midpoint, and last week closed up 16.29%. The daily view holds price above its 200-day line while the weekly still trades under its 50-week line.
Over longer windows, ADAUSD is up 10.37% on the week, 17.20% on the month and 42.81% on the quarter, but down 72.38% over the past year.
Descriptive technical summary generated by the ForexBullion Research Team from our own price feed. Not investment advice.