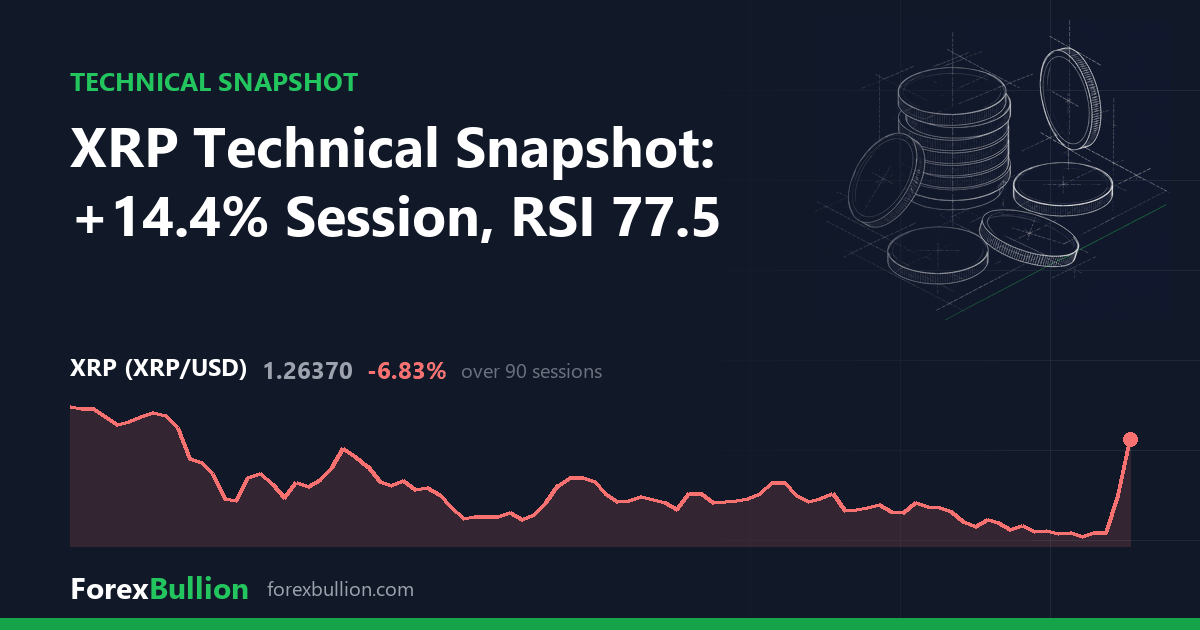
XRP (XRPUSD) last traded at 1.2637, up 14.38% on the session.
Trend
The structure reads as below the 200-day average but with a mixed short-term picture. Price sits 21.07% above its 20-day SMA (1.0438) and 17.19% above the 50-day SMA (1.0783), a wide stretch above both shorter averages. Against the 200-day SMA at 1.2757, however, price is 0.94% below — essentially level with that longer benchmark. The short-term averages sit under the long-term one, which is where the mixed label comes from.
Momentum and volatility
The 14-day RSI reads 77.5, an elevated level often described as overbought. Momentum has followed a strong push higher, with the reading well into the upper band. The ATR is 0.05, or 3.96% of price. That volatility sits at the 20th percentile against XRP’s own past year, meaning the average daily range is toward the calmer end of the last twelve months despite the size of the latest move.
Range and structure
Price sits 60.35% below the 52-week high of 3.1868 and 28.15% above the 52-week low of 0.9861. Its position in the 52-week range is the 13th percentile — low in the band. The 52-week high was set 341 sessions ago, while the 52-week low was made just 6 sessions ago, so the recent extreme is the downside one. The 20-day and 60-day swing highs both stand at 1.3434, and the 20-day and 60-day swing lows both sit at 0.9861 — the two windows share the same extremes, showing the recent range has framed the wider one. XRP has posted 2 consecutive higher closes.
Weekly picture
On the weekly timeframe the trend is below the 50-week average but with a mixed short-term structure. Price is 3.51% above the 20-week SMA (1.2209) but 25.65% below the 50-week SMA (1.6996), a large gap under the longer weekly average. The weekly RSI reads 45.8 — a mid-range reading — which contrasts with the elevated 77.5 on the daily. The two timeframes disagree here: the daily shows a stretched, overbought momentum reading, while the weekly sits near neutral and remains well below its 50-week line. Last week closed up 27.4%.
Over the longer horizon, performance shows a 26.64% week, a 10.75% month, a quarter down 5.17%, and a year down 55.68%.
Descriptive technical summary generated by the ForexBullion Research Team from our own price feed. Not investment advice.