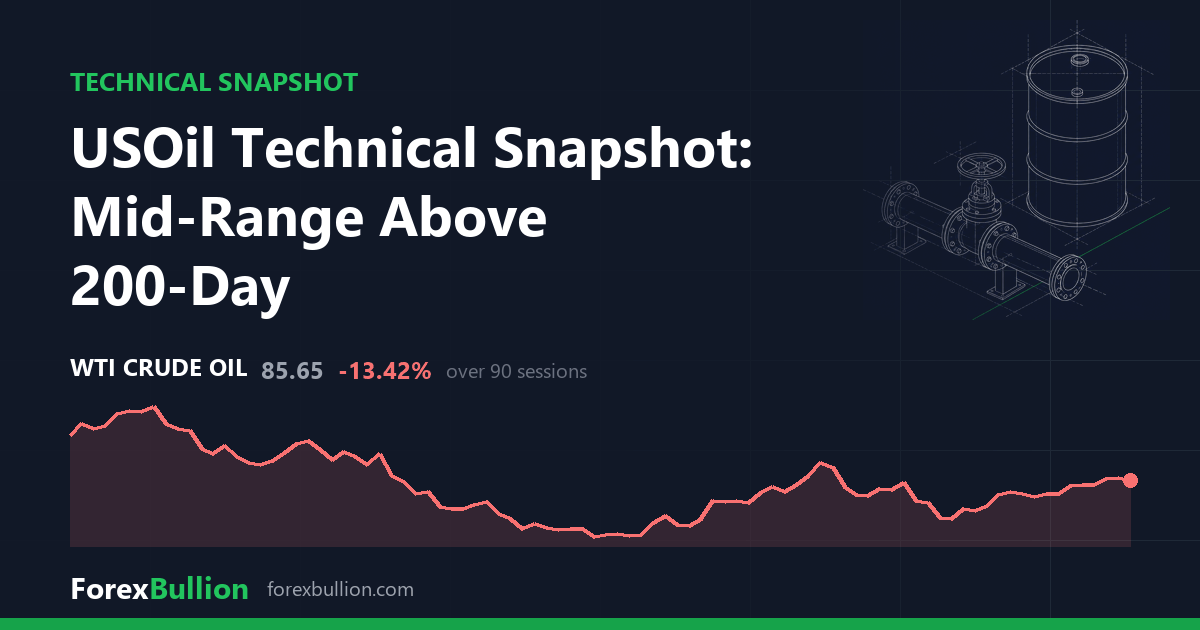
USOil (USOil) last traded at 85.65, down 0.93% on the session.
Trend
The daily structure is described as above the 200-day average but with a mixed short-term structure. Price sits 3.96% above its 200-day average (82.3837), 5.52% above the 20-day (81.168) and 8.42% above the 50-day (78.9961). With the shorter averages stacked below price and above the 200-day, the moving-average spread leans constructive even as the label flags short-term uncertainty.
Momentum and volatility
The 14-day RSI reads 59.5, placing it in neutral territory within the 30-70 band and short of any overbought or oversold extreme. The 14-day ATR is 2.8872, equal to 3.37% of price. That volatility reading sits at the 53rd percentile of the past year, essentially mid-range against USOil’s own recent history — neither unusually calm nor especially stretched.
Range position
Price is 28.32% below its 52-week high of 119.49 and 55.75% above its 52-week low of 54.99, with a range position of 48 — close to the midpoint of the yearly span. The 52-week high was set 142 sessions ago and the low 213 sessions ago, so both extremes are well behind the current market. Over the last 20 days, price has ranged between a swing high of 87.53 and a swing low of 73.53; the wider 60-day window spans a swing high of 92.44 and a swing low of 67.95. At 85.65, price sits just under the 20-day swing high.
Weekly picture
The weekly frame is described as above the 50-week average but with a mixed short-term structure — a close echo of the daily read. On this timeframe price is 13.76% above its 50-week average (75.99) but 1.32% below its 20-week average (87.6045), so the longer weekly trend is supportive while the shorter weekly average sits just above current price. The weekly RSI is 52.9, near neutral, and the most recent week gained 6.05%. The daily and weekly views broadly agree on the longer-term uptrend, with the one point of tension being price trading beneath the 20-week average despite holding above every daily average.
Over the recent windows, USOil is up 1.9% on the week but down 4.21% on the month and 8.58% on the quarter, while the trailing year shows a gain of 34.65%.
Descriptive technical summary generated by the ForexBullion Research Team from our own price feed. Not investment advice.