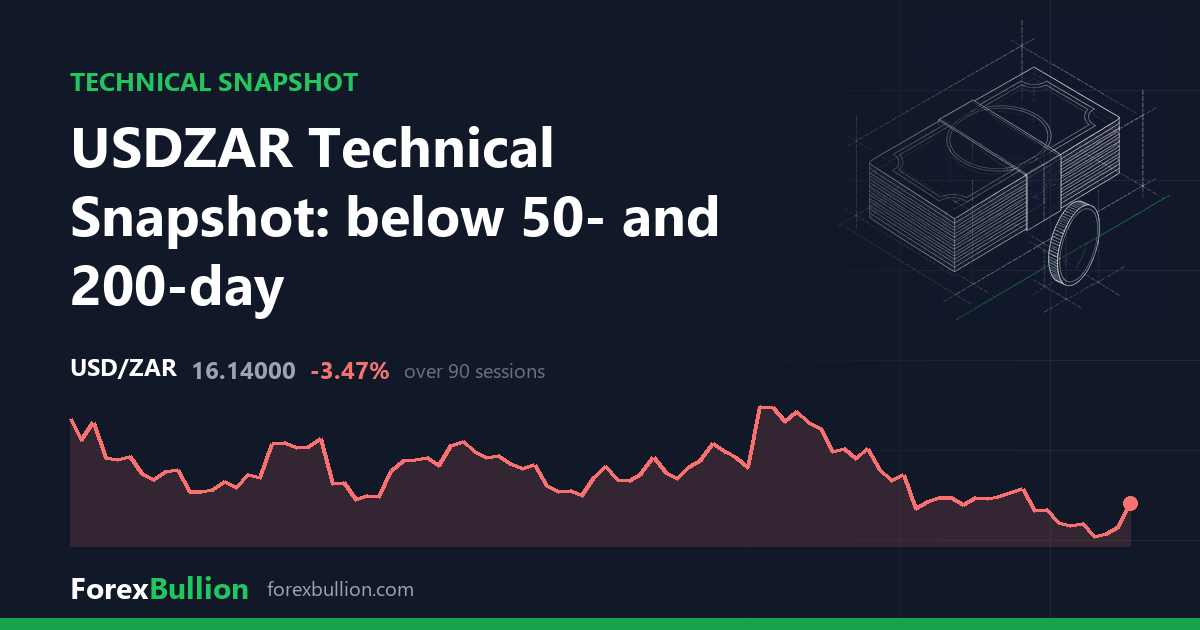
The US Dollar / South African Rand (USDZAR) last traded at 16.14, up 0.97% on the session.
Trend
The daily structure reads as a downtrend, with price below the 50-day and the 50-day below the 200-day. At 16.14 the pair sits 0.17% above its 20-day average (16.1131) but 1.08% below the 50-day (16.316) and 1.51% below the 200-day (16.3876). The proximity to the short-term mean against the gap to the longer averages captures a rate that has firmed recently within a broader decline.
Momentum and volatility
RSI(14) reads 48.0, squarely in neutral territory (30-70) and consistent with the lack of a directional extreme on the daily chart. ATR(14) is 0.165, or 1.02% of price. That volatility reading sits at the 49th percentile against the pair’s own past year — right at the mid-point, neither compressed nor stretched by recent standards. This move comes on 3 consecutive higher closes.
Within its range, USDZAR sits 9.4% below the 52-week high of 17.814 and 3.34% above the 52-week low of 15.619. The range_position_pct of 24 places price in the lower quarter of the 52-week band. The high was set 307 sessions ago, while the low is more recent at 181 sessions back. The 20-day swing spans 15.842 to 16.378, and the 60-day swing runs from the same 15.842 low up to 16.975 — the current price sits between those markers.
Weekly picture
The weekly timeframe agrees with the daily read: it also shows a downtrend, with price below the 20-week average (16.3864) and the 20-week below the 50-week (16.6408). Price is 1.5% under the 20-week and 3.01% under the 50-week. Weekly RSI(14) is 43.7, a touch softer than the daily 48.0 but still neutral. Last week closed up 0.95%, echoing the recent daily firmness even as both timeframes retain their downward structure.
On performance, the pair is up 0.82% over the past week but down 2.15% over the month, 0.49% over the quarter, and 8.46% across the year.
Descriptive technical summary generated by the ForexBullion Research Team from our own price feed. Not investment advice.