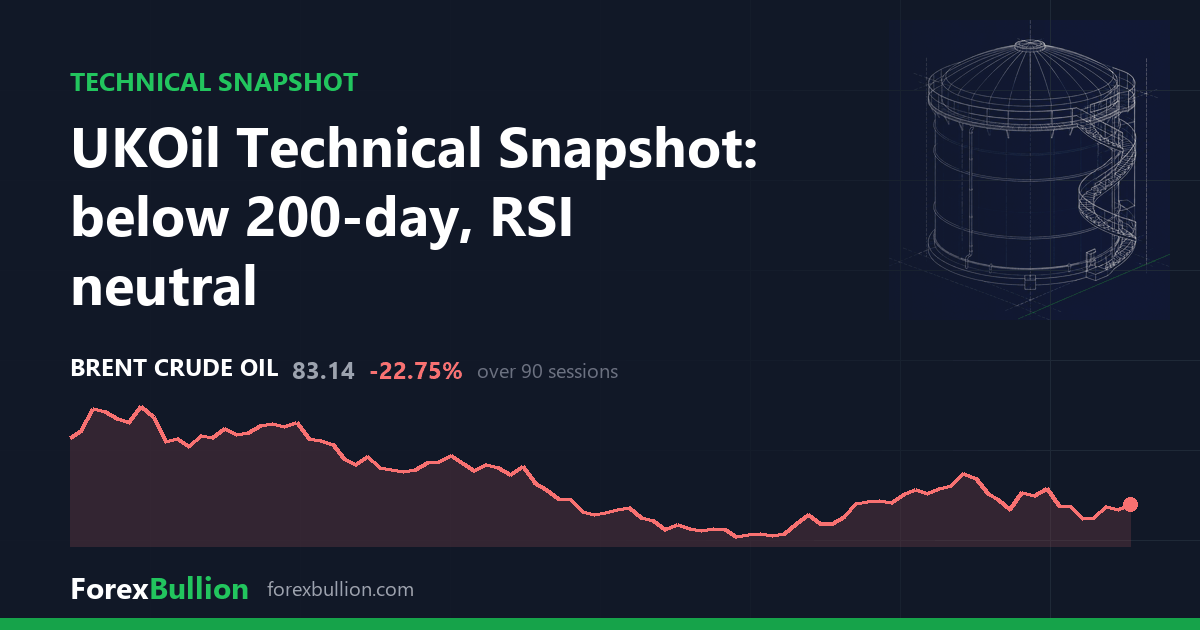
UKOil (UKOil) last traded at 83.14, up 2.25% on the session.
Trend
The daily structure reads as below the 200-day average but with a mixed short-term structure. Price sits 3.18% under the 200-day SMA (85.87) and 3.03% under the 20-day SMA (85.74), but holds 2.17% above the 50-day SMA (81.38). That split — under the longer averages, over the medium one — is the mixed picture the trend string points to.
Momentum and volatility
The 14-day RSI reads 49.2, a neutral value in the 30-70 band, sitting close to the midpoint. The ATR14 is 3.96, or 4.76% of price. Against UKOil’s own past year that volatility sits at the 68th percentile — elevated relative to most of the prior twelve months, though not at an extreme.
Within its range, price sits 31.02% below the 52-week high of 120.53 and 41.16% above the 52-week low of 58.90. The range-position reading of 39 places it in the lower half of that 52-week span. The 52-week high was set 86 sessions ago; the low was made 199 sessions ago, a more distant marker. Nearer term, the 20-day swing runs from 77.50 to 95.50, and the 60-day swing spans 70.86 to 102.13 — placing the current 83.14 in the lower portion of both windows.
Weekly picture
The weekly chart reads as above the 50-week average but with a mixed short-term structure. Price is 2.01% above the 50-week SMA (79.71) but 14.24% below the 20-week SMA (94.81), a wider gap than on the daily 20-period comparison. The weekly RSI14 is 45.9, marginally below its daily counterpart, and last week closed down 2.01%. The weekly and daily timeframes broadly align: both hold above one medium-term average while trailing a longer or higher one, leaving neither strongly directional.
On performance, UKOil is up 0.66% over the past week and 8.66% over the past month, but down 22.77% over the quarter while up 25.98% across the past year — the longer horizon positive against a weaker three-month stretch.
Descriptive technical summary generated by the ForexBullion Research Team from our own price feed. Not investment advice.