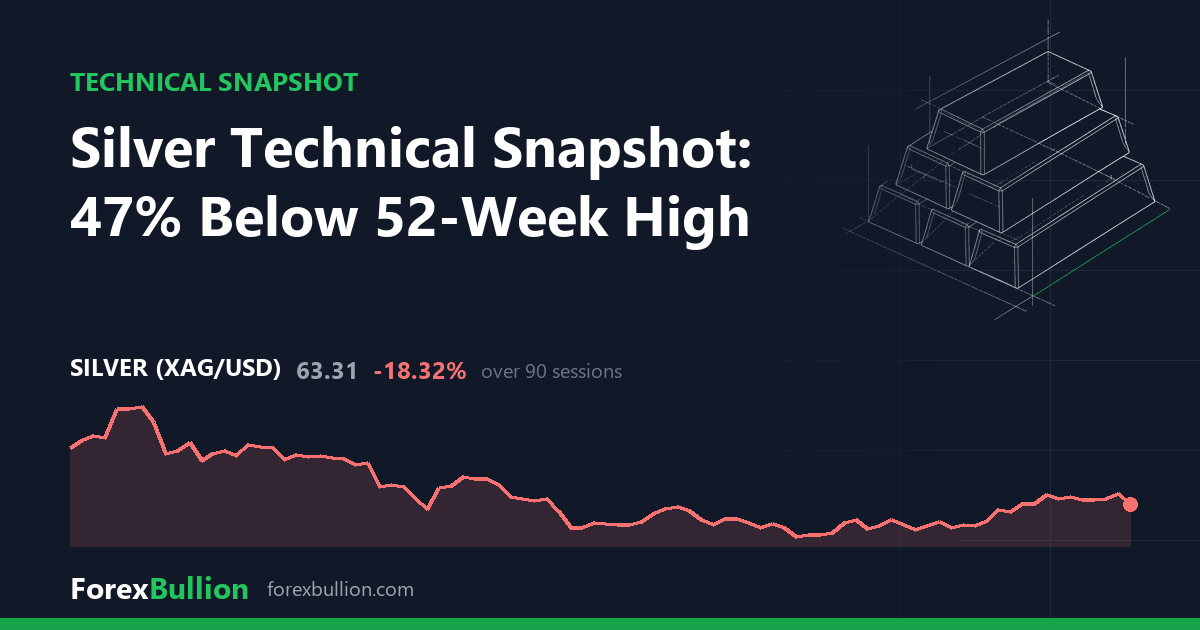
Silver (XAGUSD) trades at 63.31, down 4.0% on the session.
Trend
The daily structure reads as below the 200-day average but with a mixed short-term structure. Price sits 2.42% above its 20-day SMA (61.82) and 5.23% above its 50-day SMA (60.17), yet remains 15.01% below the 200-day SMA (74.50). That split — above the faster averages, well under the slow one — is the source of the mixed description.
Momentum and volatility
RSI(14) reads 53.8, a neutral value inside the 30-70 band, holding just above the midpoint. The 14-day ATR is 2.213, equal to 3.5% of price. Against silver’s own past year that volatility sits at the 37th percentile, toward the lower end of the twelve-month range rather than at an extreme.
Price sits at the 31st percentile of its 52-week range, in the lower third of the span between the year’s extremes. The 52-week high of 121.61 stands 47.94% above the current print and was set 171 sessions ago. The 52-week low of 36.95 lies 71.35% below current levels and dates back 310 sessions, so both extremes are distant in time. Nearer by, the 20-day swing runs from 56.55 to 66.79, and the wider 60-day band spans 54.76 to 71.55, placing the last price toward the upper part of the recent one-month range but in the middle of the two-month range.
Weekly picture
The weekly frame is described as below the 50-week average but with a mixed short-term structure, echoing the daily read of a metal beneath its longer average. On the weekly, price is 7.04% below its 20-week SMA (68.11) and 5.81% below its 50-week SMA (67.21) — a notable contrast with the daily chart, where price sits above the 20- and 50-day lines. That divergence marks the two timeframes as disagreeing on the shorter averages. Weekly RSI(14) is 47.0, below its daily counterpart and just under the neutral midpoint. The prior week closed down 2.3%.
Across the performance windows, silver is down 3.02% over the past week and off 16.6% over the quarter, while the trailing month shows a 12.38% gain. Over the trailing year the metal is up 69.5%.
Descriptive technical summary generated by the ForexBullion Research Team from our own price feed. Not investment advice.