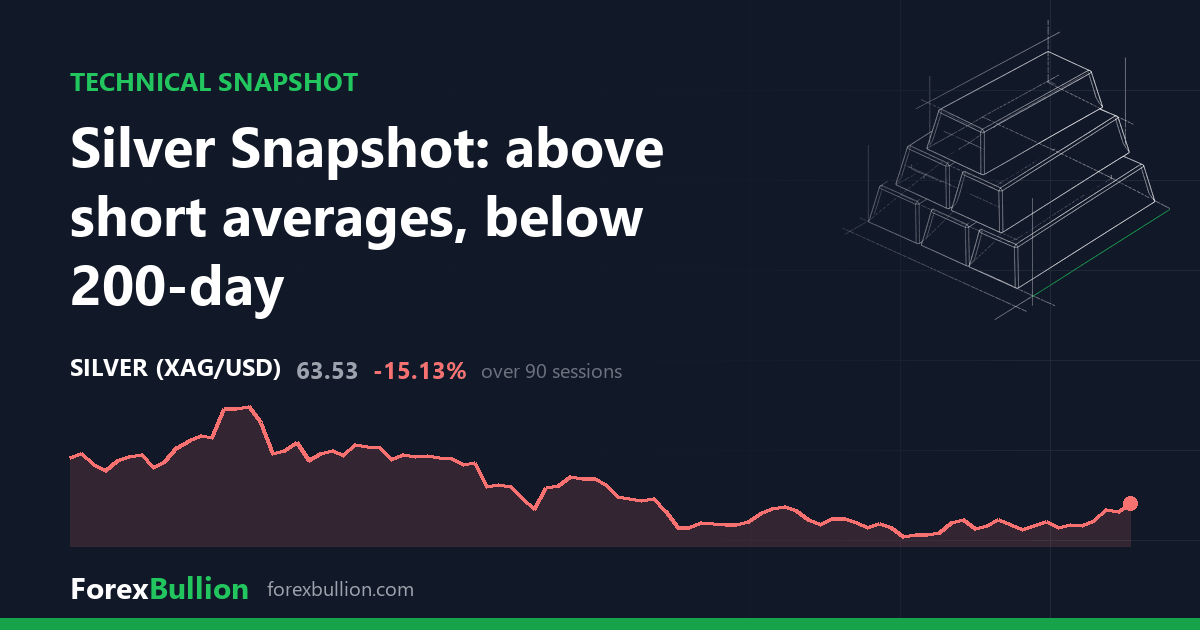
Silver (XAGUSD) last traded at 63.53, up 3.07% on the session.
Trend
The structure reads as below the 200-day average but with a mixed short-term picture. Price sits 8.47% above its 20-day SMA (58.57) and 4.69% above its 50-day SMA (60.68), so the shorter averages sit beneath the current level. The 200-day SMA at 74.74 remains well overhead, with price 15.0% below it. The near-term averages and the long-term average point in different directions.
Momentum and volatility
RSI(14) reads 61.7, a neutral setting within the 30-70 band. The 14-day ATR is 2.3844, equal to 3.75% of price. Measured against Silver’s own past year, that volatility sits at the 28th percentile — toward the lower end of the range seen over the trailing twelve months, despite the size of today’s move.
Range
Silver sits 47.76% below its 52-week high of 121.61 and 39.55% above its 52-week low of 45.52, placing it at roughly the 24th percentile of that one-year span — in the lower quarter of its range. The 52-week high was set 162 sessions ago and the low 242 sessions ago, so both extremes are distant. Nearer by, the 20-day swing high is 65.12 and the 20-day swing low 54.76; over 60 days the swing high stretches to 77.00 with the same 54.76 low. Price now trades just under that 20-day swing high.
Performance layers the timeframes: Silver is up 8.98% on the week and 8.08% over the month, yet down 17.87% over the quarter and up 17.04% across the year. The recent weeks have recovered ground within a quarter that remains negative.
Weekly picture
The weekly frame shows a similar tension: price is below the 50-week average but with a mixed short-term structure. It sits 7.52% below the 20-week SMA (68.69) and 4.13% below the 50-week SMA (66.27) — the opposite arrangement to the daily chart, where price is above both its 20- and 50-day lines. The weekly RSI(14) reads 47.1, close to the midpoint and lower than the daily RSI of 61.7. In short, the two timeframes disagree: the daily view has price above its near-term averages while the weekly view keeps it beneath both weekly averages. The last week closed up 8.98%.
Over the trailing year, Silver’s price is 17.04% higher, while sitting nearly halfway down from its 52-week high.
Descriptive technical summary generated by the ForexBullion Research Team from our own price feed. Not investment advice.
Correction, 9 September 2026. This article stated a 52-week low of 45.525. The correct figure at the time of publication was 36.948. Our 52-week window was computed over 252 trading sessions, which is a full year only for markets that close at weekends; for instruments trading seven days a week it covered about 36 weeks. The calculation was corrected on 8 August 2026 and the figures on our instrument pages now reflect a full calendar year; this notice records the error on the articles that carried it. No other figure in this article is affected.