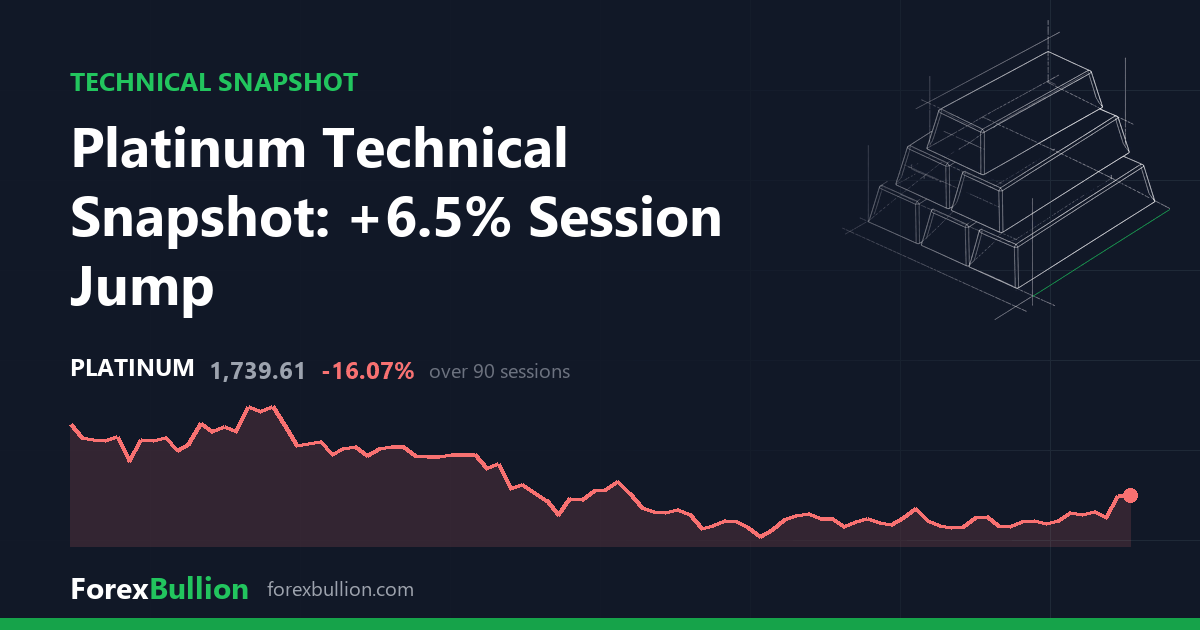
Platinum (XPTUSD) last traded at 1740.16, up 6.5% on the session.
Trend
The structure reads as below the 200-day average but with a mixed short-term picture. Price sits 6.82% above its 20-day SMA (1629.08) and 5.71% above the 50-day SMA (1646.10), showing near-term strength relative to those shorter averages. Against the 200-day SMA (1992.31), however, price remains 12.66% lower, so the longer-term average is still well overhead.
Momentum and Volatility
RSI(14) stands at 63.2, a reading described as neutral within the 30-70 band — elevated but not into overbought territory. The 14-day ATR is 56.36 in price terms, equivalent to 3.24% of the current price, a gauge of the daily range Platinum has recently been covering.
Range
Price is 40.39% below its 52-week high of 2919.36 and 16.94% above its 52-week low of 1488.09. The most recent 20-day swing places today’s level between a swing low of 1556.38 and a swing high of 1754.42, with price near the upper end of that band. Widening to 60 days, the swing high is 1981.62 and the swing low 1529.34, framing a broader reference range that price currently sits inside.
Over the longer view, Platinum shows a weekly change of 7.32%, a monthly change of 6.61%, a quarterly change of -9.68%, and a year-to-date figure of 7.42%.
Descriptive technical summary generated by the ForexBullion Research Team from our own price feed. Not investment advice.