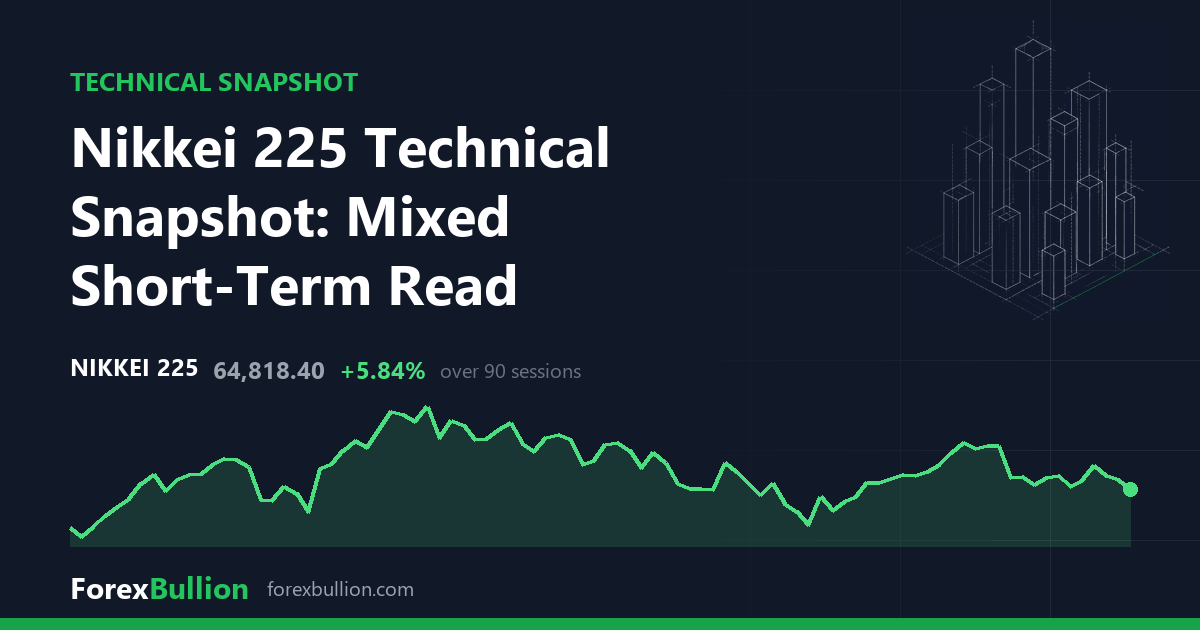
The Nikkei 225 (JP225) is trading at 64,818.4, down 1.5% on the session.
Trend and moving averages
The structure reads as above the 200-day average but with a mixed short-term structure. Price sits 6.35% above its 200-day average at 60,946.14, confirming the longer-run uptrend, yet it trades below both nearer averages: 2.84% under the 20-day (66,711.20) and 2.26% under the 50-day (66,315.17). That places the shorter and medium averages overhead while the long-term line remains well beneath price.
Momentum and volatility
The 14-day RSI reads 43.5, a neutral value in the 30-70 band, leaning toward the lower half of the range. ATR over 14 days is 1,544.35, or 2.38% of price. Against the instrument’s own past year, that volatility sits at the 65th percentile, so the current daily range is toward the higher end but not an extreme.
Price sits in the middle of its 52-week span. The 52-week high of 73,620.5 is 11.96% above the last price, and that high was set 59 sessions ago. The 52-week low of 41,720.0 is 55.37% below current levels and was recorded 310 sessions back. The range-position reading of 72 places price in the upper portion of that 52-week band. Over the last 20 days the swing high is 69,608.44 and the swing low is 64,604.78 — the latter close to the current price. The 60-day swing high matches the 52-week high at 73,620.5, with a 60-day swing low of 60,429.73. Price has posted 3 consecutive lower closes.
Weekly picture
The weekly frame reads as an uptrend, with price above the 20-week average and the 20-week above the 50-week. Price sits 0.74% above the 20-week line (65,323.23) and 15.24% above the 50-week line (57,105.33). The weekly RSI is 56.2, in the upper-neutral zone, and last week closed down 0.57%. The weekly uptrend contrasts with the daily picture, where price has slipped below its 20- and 50-day averages — the two timeframes disagree on the short-term footing while agreeing that the longer-run direction remains higher.
Over the trailing year the index is up 53.17%, with the last week down 0.5%, the last month up 3.22%, and the last quarter down 3.48%.
Descriptive technical summary generated by the ForexBullion Research Team from our own price feed. Not investment advice.